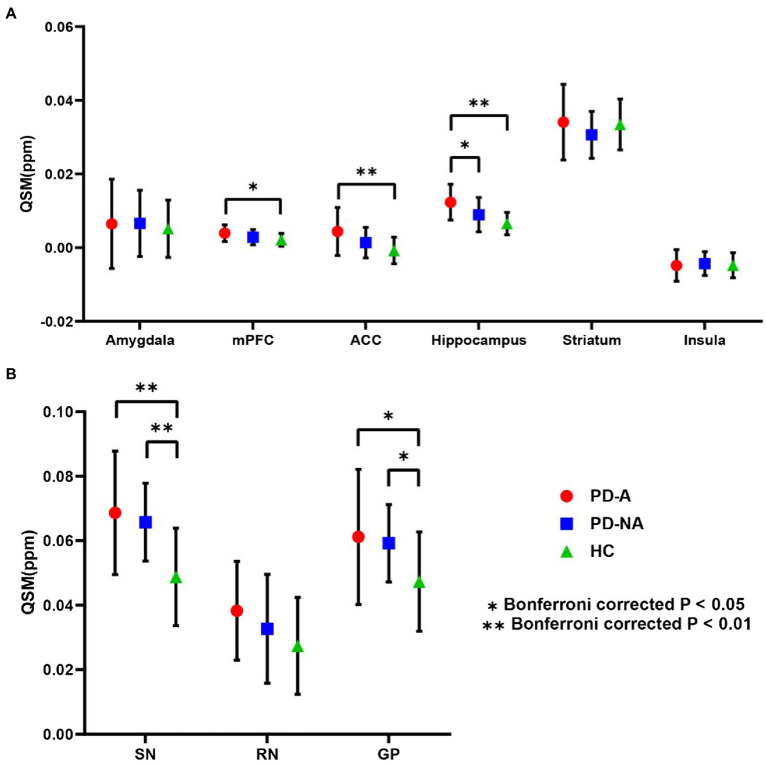
Figure 3.
ROI-based QSM analysis. Regional mean QSM values in (A) the fear circuit ROIs and (B) iron deposition-based ROIs. Error bars signify the standard error of the mean. Stars denote significant differences between the groups: *Bonferroni-corrected p < 0.05; **Bonferronicorrected p < 0.01. QSM, quantitative susceptibility mapping; ROI, region of interest; PD-A, Parkinson’s disease with anxiety; PD-NA, Parkinson’s disease without anxiety; HC, healthy control; mPFC, medial prefrontal cortex; ACC, anterior cingulate cortex; SN, substantia nigra; RN, red nucleus; GP, globus pallidus.

