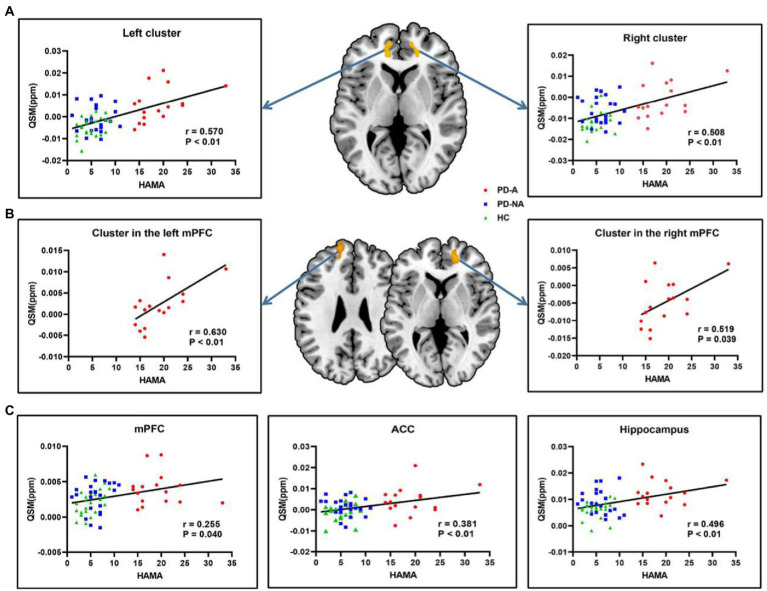
Figure 4.
Correlation analysis in all subjects and in the single PD-A group. (A) The clusters with warm color represent significantly correlations between voxel-wise QSM values and HAMA scores in all subjects. (B) The clusters with warm color represent significantly correlations between voxel-wise QSM values and HAMA scores in the single PD-A group. (C) Significantly correlations between regional QSM values and HAMA scores in all subjects. QSM, Quantitative Susceptibility Mapping, HAMA, the Hamilton Anxiety Rating Scale, mPFC, medial prefrontal cortex; ACC, anterior cingulate cortex.

