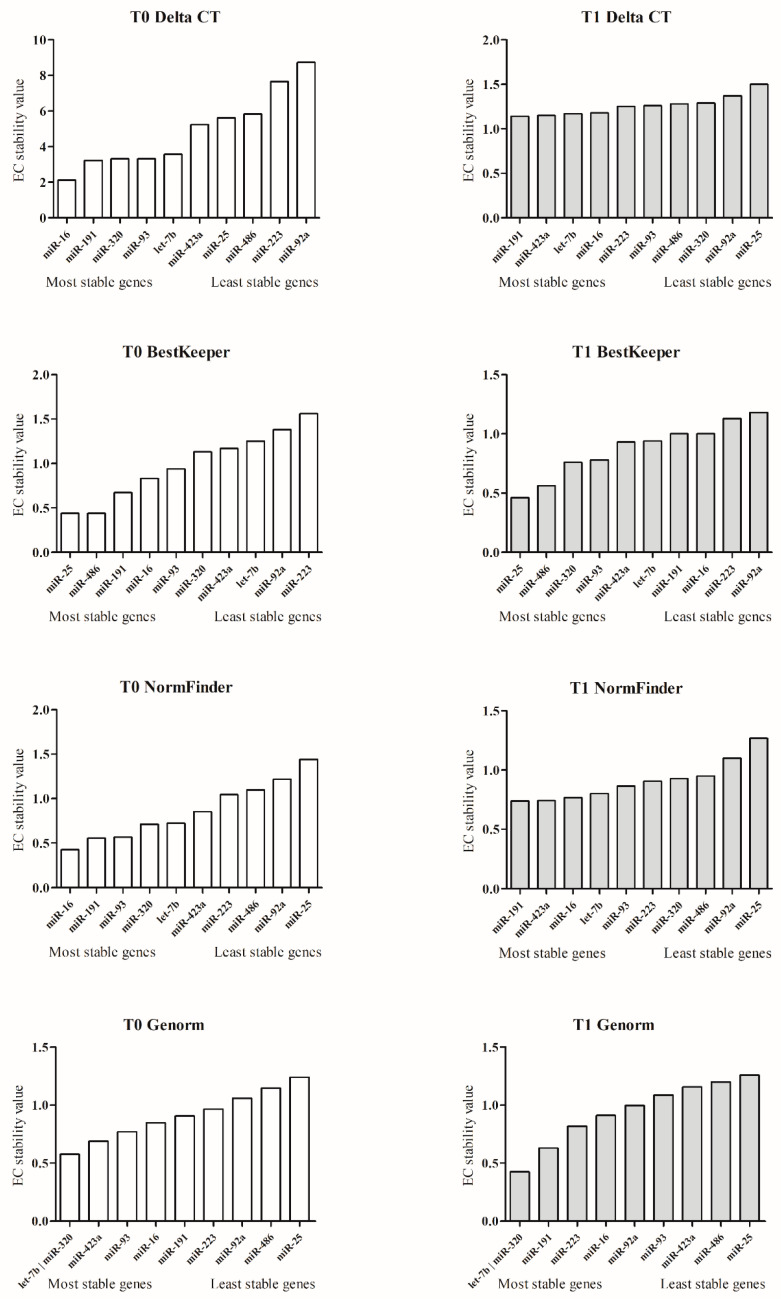
Figure 2.
MiRNA stability value. The figure shows the EC miRNA stability value resulting from the Delta-Ct, BestKeeper, NormFinder, and GeNorm mathematical approaches. The left column plots (white) show the stability of miRNAs evaluated at T0, and the right column plots (grey) the miRNA stability assessed at T1. The miRNAs on the x-axis, near the origin, are the most stable; conversely, the miRNAs that are distant are the least stable.

