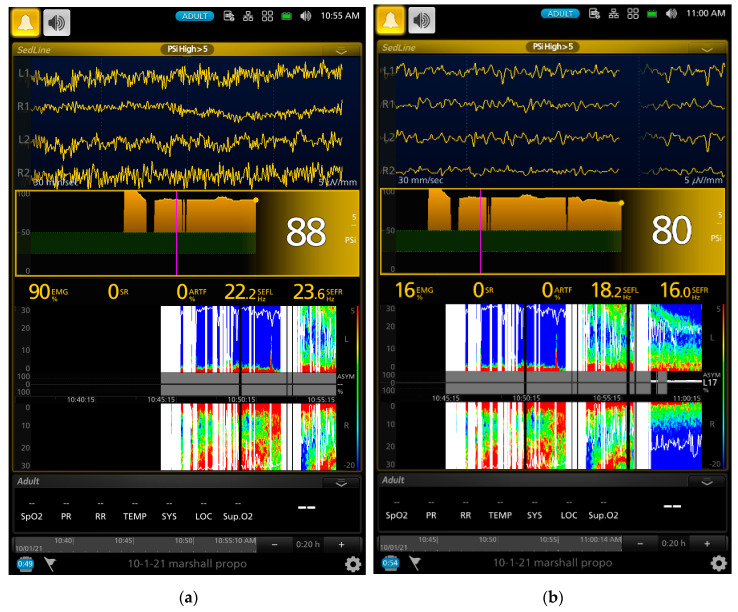
Figure 2.
Screenshots of a dog that exhibited paradoxical excitation’s EEG pattern during slow propofol induction. The raw EEG waveforms (the 4 EEG channels in the upper portion of the screen) show regular oscillations of low and high beta waves (a). The SEFL95 (22.2 Hz) and SEFR95 (23.6 Hz) are outlined as the white horizontal lines in (a,b), which indicate 95% of the waves are below these frequency ranges. The intensity of the spectral patterns of the high and low beta waves (18–30 Hz) appeared on the DSA screen while some intensity of the delta and theta waves appeared in bright red on the DSA screen. The high EMG (90% in (a)) indicates a strong muscle activity that can be observed as high-intensity bright spectral color pattern in the DSA. As the propofol induction continued, the EEG patterns shifted from the regular beta waves to large slow oscillation of alpha, theta, and delta EEG patterns (b) with SEFR95 and SEFL95 of 16.0 Hz and 18.2 Hz, respectively. The PSI value also decreased from 88 (a) to 80 (b) and the EMG value decreased from 90% down to 16%. The color map showed a zipper opening pattern with a reduction in the intensity of high beta toward the alpha spectral pattern as a transition into a deeper plane of anesthesia.

