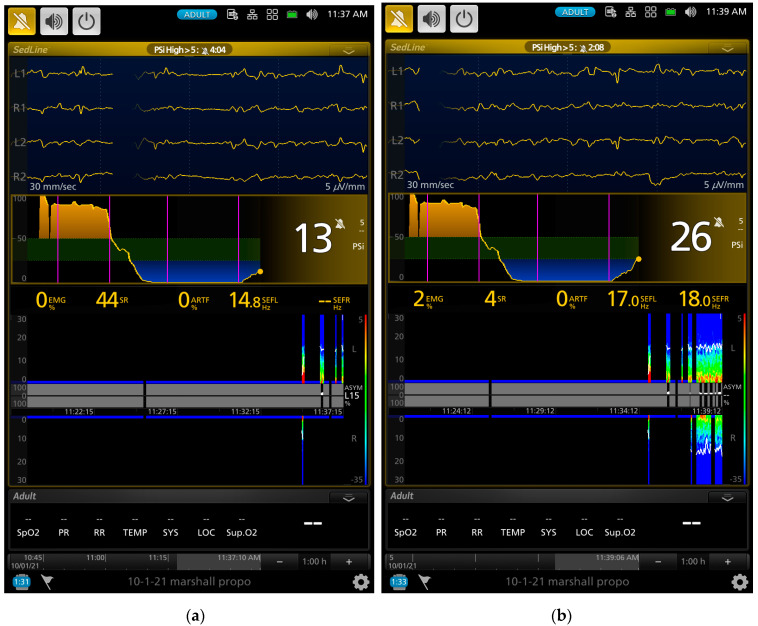
Figure 4.
A continuation of EEG screenshots of the same dog shown in Figure 2 and Figure 3. The 4 vertical pink lines (from the left to right of the screen) indicate the initiation of propofol induction, beginning of the 2.4, 1.6, and 0.8 mg/kg/min of propofol CRI, respectively. The trend in the PSI values over time (the middle of the screen) showed the PSI values went from an awake level near 100 to zero during the 2.4 and 1.6 mg/kg/min of propofol CRI and then gradually return to 13 and then 26 when the CRI propofol dosages were reduced to 0.8 mg/kg/min. The raw EEG pattern showed returning of a slow delta–theta wave oscillatory activity (similar to the EEG pattern of Figure 3a) from the previous isoelectric flat line waveform with the occasion of EEG bursts (Figure 3b). The burst suppression ratio value decreased from 44% (a) to 4% (b). The SEFL95 and SEFR95 were 17.0 and 18.0 Hz in (b).

