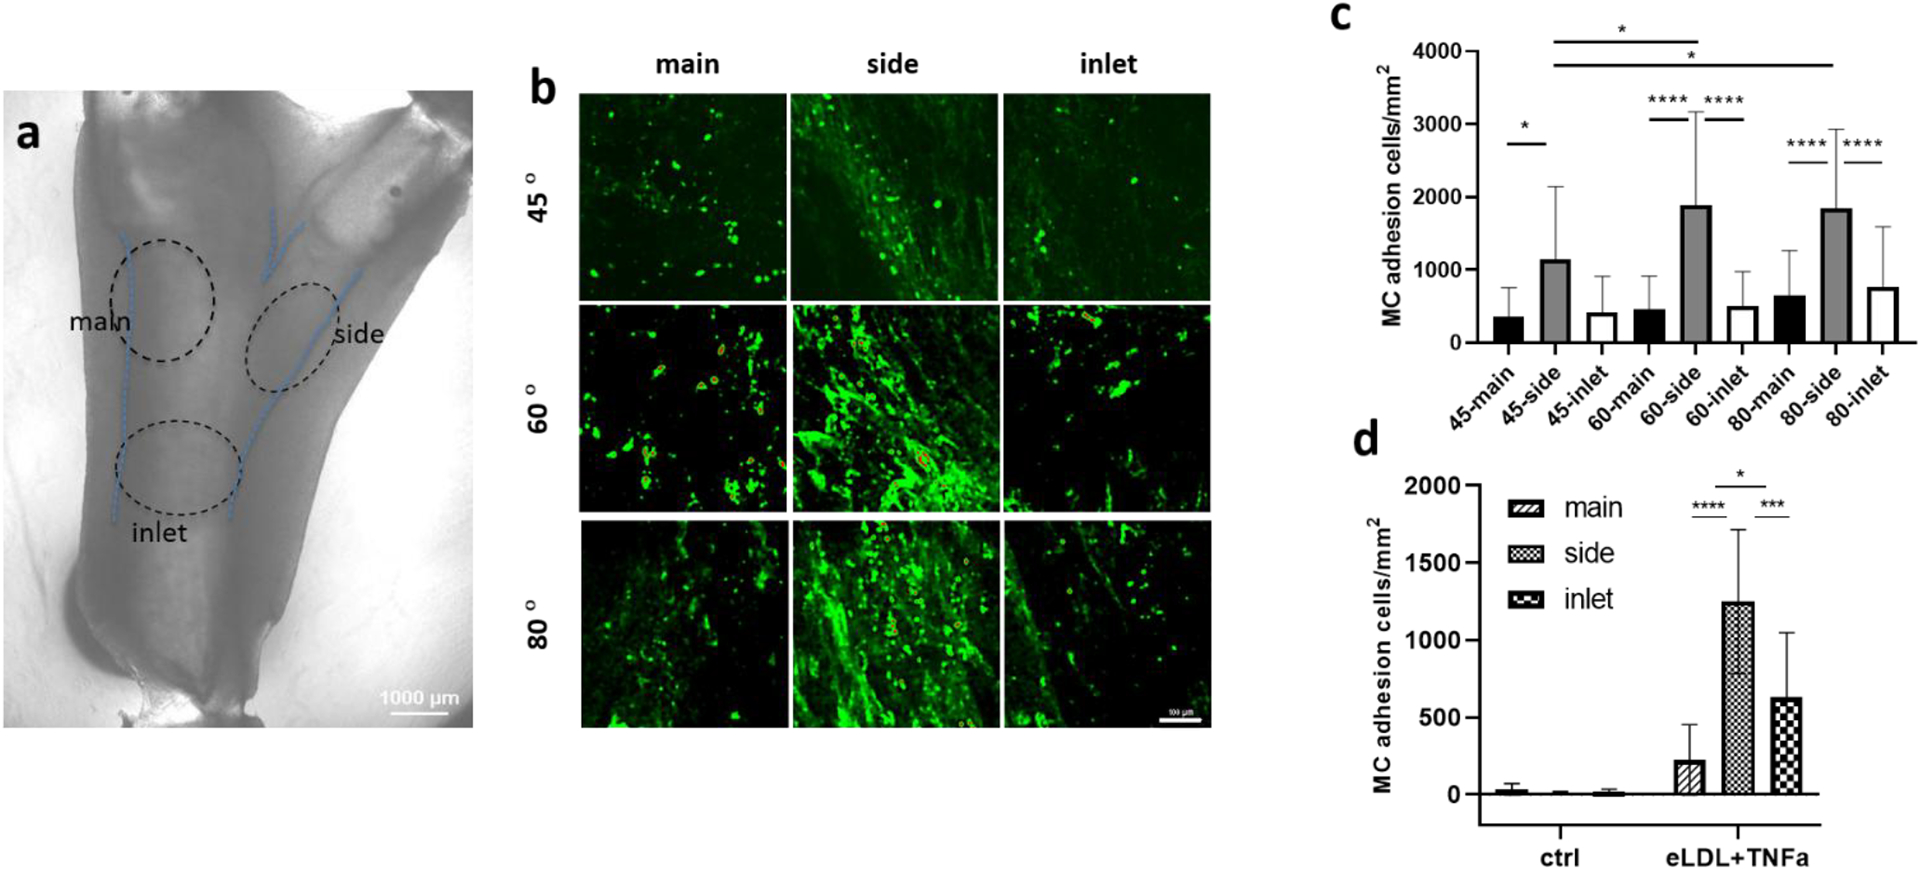
Figure 4. Localization of MC adhesion in brTEBVs at various branching angles.

(a) Brightfield image of brTEBV with branching angle of 45° is shown with categorized area of inlet, main and side outlets (dotted circles), where MC adhesion was considered. (b) Fluorescence images of CellTracker Green-labeled MCs in each brTEBV area. Scale bar: 100 μm (c) Quantitative analysis of effect of branching angle on MC adhesion in each area with 10 μg mL−1 eLDL and 50 ng mL−1 TNF-α treatment; n ≥ 4 vessels from 5 independent experiments; Kruskal–Wallis two-way ANOVA test multiple comparisons. (d) Effect of eLDL and TNF-α on MC adhesion; n ≥ 3 vessels from 2 independent experiments; one-way ANOVA Tukey test. * P<0.05, ** P <0.01, *** P <0.001, **** P <0.0001.
