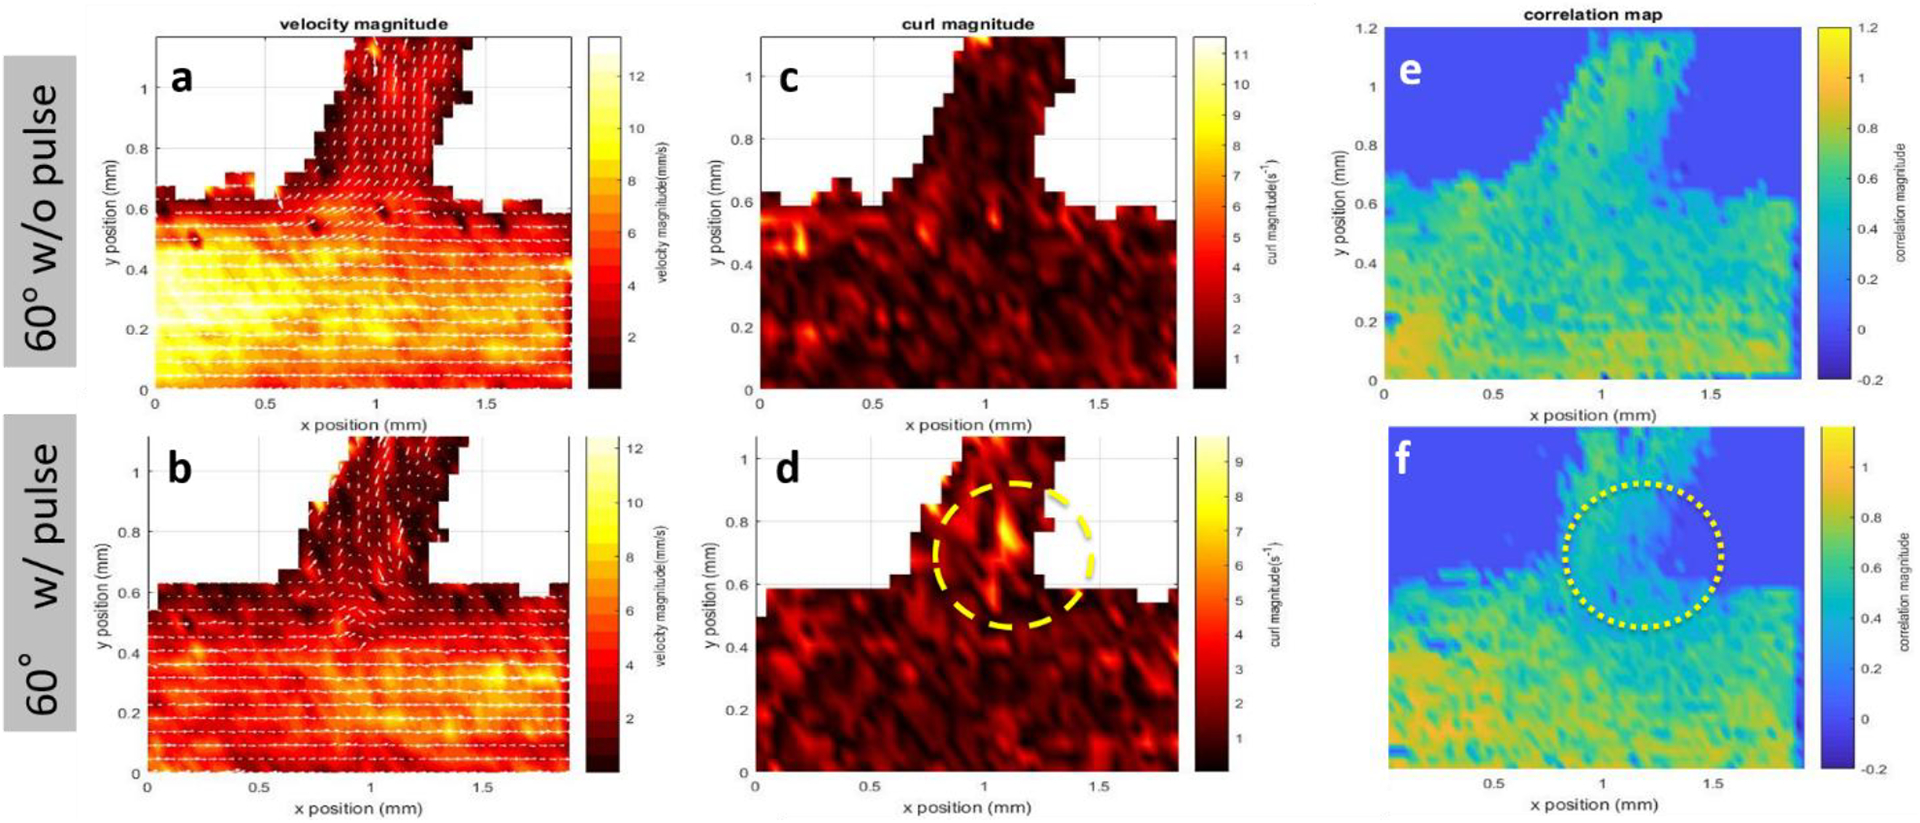
Figure 5. Quantitative analysis of PIV results.

PIV results for a brTEBV with branching angle of 60° at 4 mL min−1 with 1 Hz pulsing (bottom row: b,d,f), and without pulsing (top row: a,c,e). (a-b) Velocity magnitude profiles. (c-d) Curl magnitude maps. (e-f) Spatial and temporal correlation maps.
