
Figure 8.
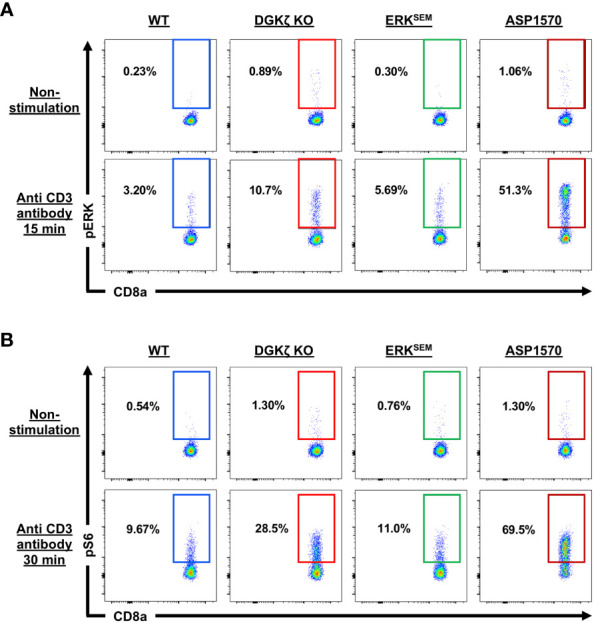
ERK and S6 phosphorylation in TCR-stimulated DGKζ KO, ERKSEM, and ASP1570-treated CD8+ T cells. (A) Representative flow cytometric plots of CD44lo CD8+ T cells displaying pERK and (B) pS6 are shown in unstimulated and CD3-stimulated CD44lo CD8+ T cells of the indicated genotype and treatment. One representative of 2 experiments is shown.