
Figure 2. Temporal ordering of clinical and biomarker changes in F-FTD.
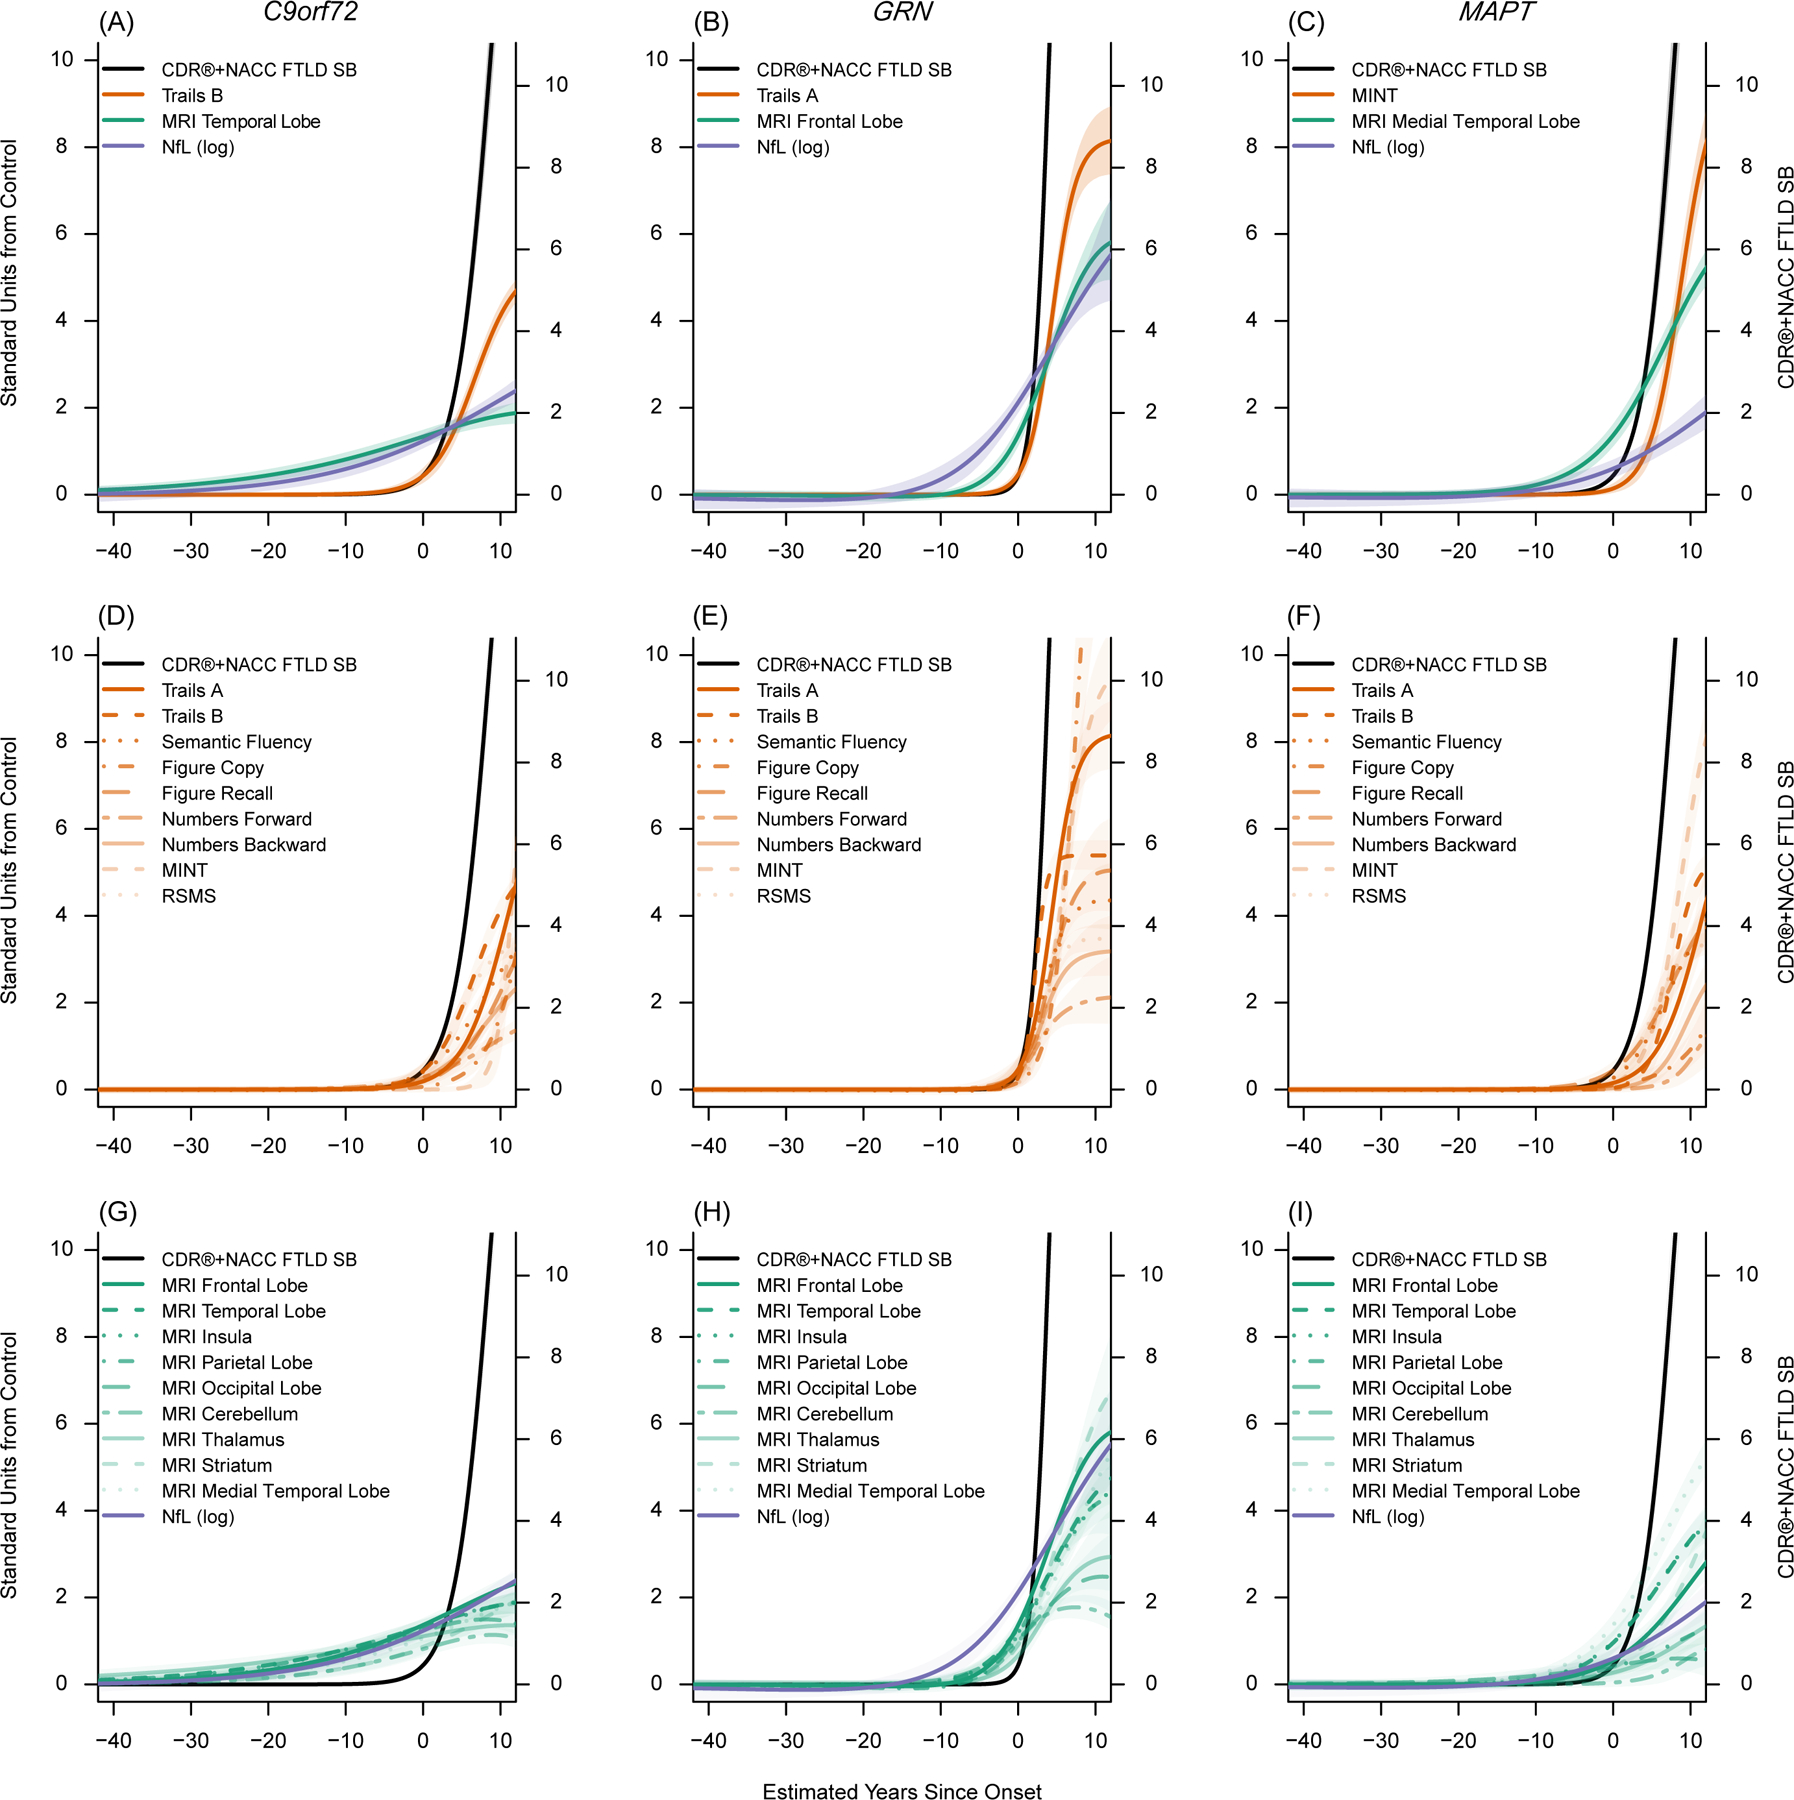
These figures display the empirically derived model-estimated curves in each genetic group. In all figures, model estimated time from onset (years) is on the x-axis. The left y-axis indicates the number of standard deviations (SD) of abnormality compared to controls. The right y-axis indicates CDR®+NACC FTLD Box Score units to provide a context for understanding the degree of clinical impairment associated with changes in the other biomarkers and to provide a raw estimate corresponding to the standardized CDR®+NACC FTLD Box Score (black line). Panels A-C display the mean curves for the CDR®+NACC FTLD Box Score, NfL, and a selected imaging and clinical measure for each genetic group, based on which measure is first elevated by one standard deviation from controls and the measure’s rate of longitudinal progression. All clinical, imaging, and fluid biomarkers are displayed in the remaining panels (D-I). The shaded areas indicate the 95% credible interval of the estimate. These figures suggest brain atrophy and elevations in neurofilament light chain levels are detectable prior to symptom onset, and that each mutation shows a unique cascade of biomarker changes.
Abbreviations: CDR®+NACC FTLD SB: Clinical Dementia Rating Scale plus National Alzheimer’s Coordinating Center’s Frontotemporal Lobar Degeneration Module Sum of Boxes; Trail B: Trail Making Test, Part B; MINT: Multilingual Naming Test; RSMS: Revised Self Monitoring Scale; MRI: magnetic resonance imaging; NfL (log): Log-transformed plasma neurofilament light chain; Stand: Standard