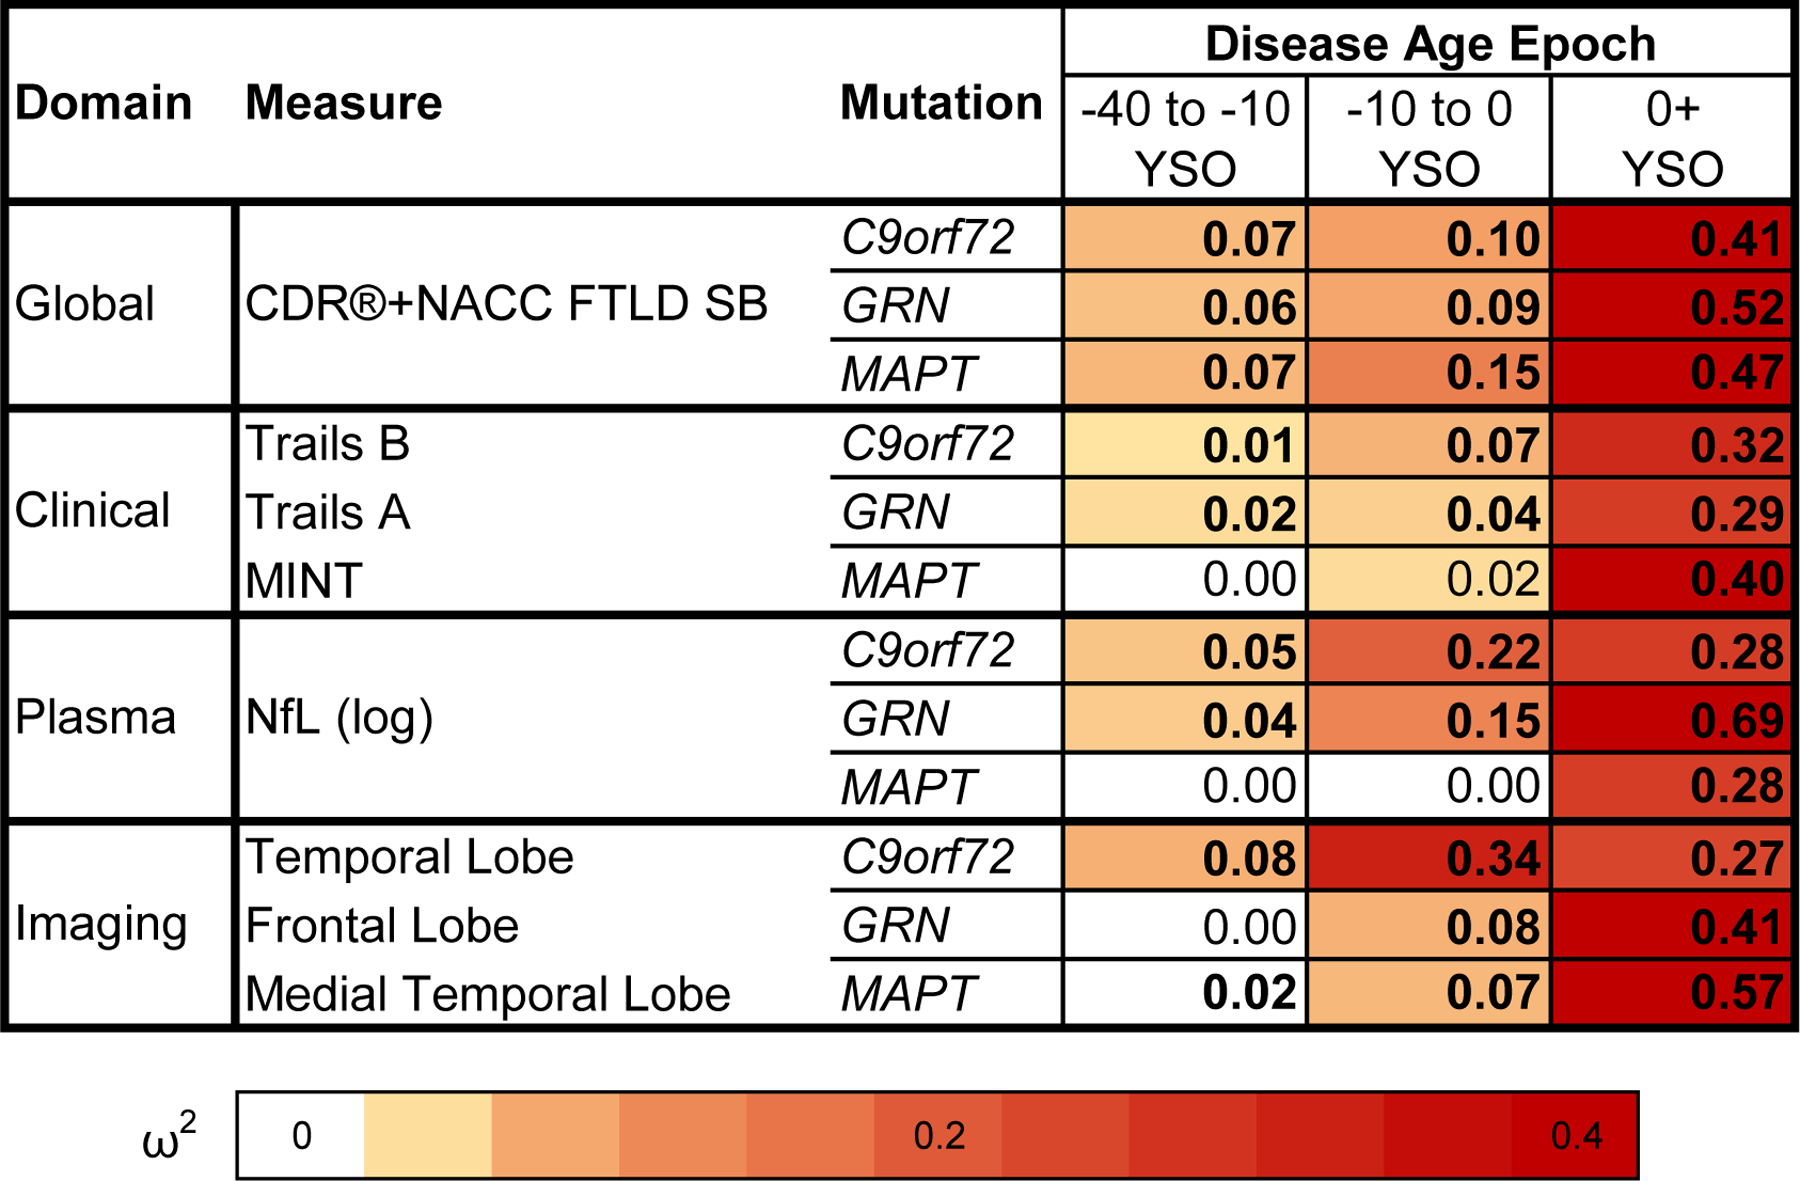
Figure 3. Comparison of mutation carriers with controls at three epochs of disease age.

Cross-sectional baseline differences between mutation carriers and controls are presented as effect sizes (omega squared). Bolded cells indicate statistical significance (p < .05). Comparisons in which mutation carriers are more impaired than controls at an omega squared > 0.00 are colored, with darker shades illustrating larger effect sizes. CDR®+NACC FTLD SB scores and log-transformed NfL levels are presented for all genetic groups. Clinical and imaging measures were selected for each genetic group based on how early they deviated from controls in the disease progression model and rate of longitudinal progression. Note that statistical comparisons for the CDR®+NACC FTLD SB should be interpreted with caution given that controls were defined as having a baseline CDR®+NACC-FTLD=0 and thus have no variance due to this selection process. A similar figure including all modeled measures can be found in the extended data figures (Extended Data Fig 1). YSO = years since onset.
