
Extended Data Fig. 1. Baseline comparisons between mutation carriers and controls by disease age epoch.
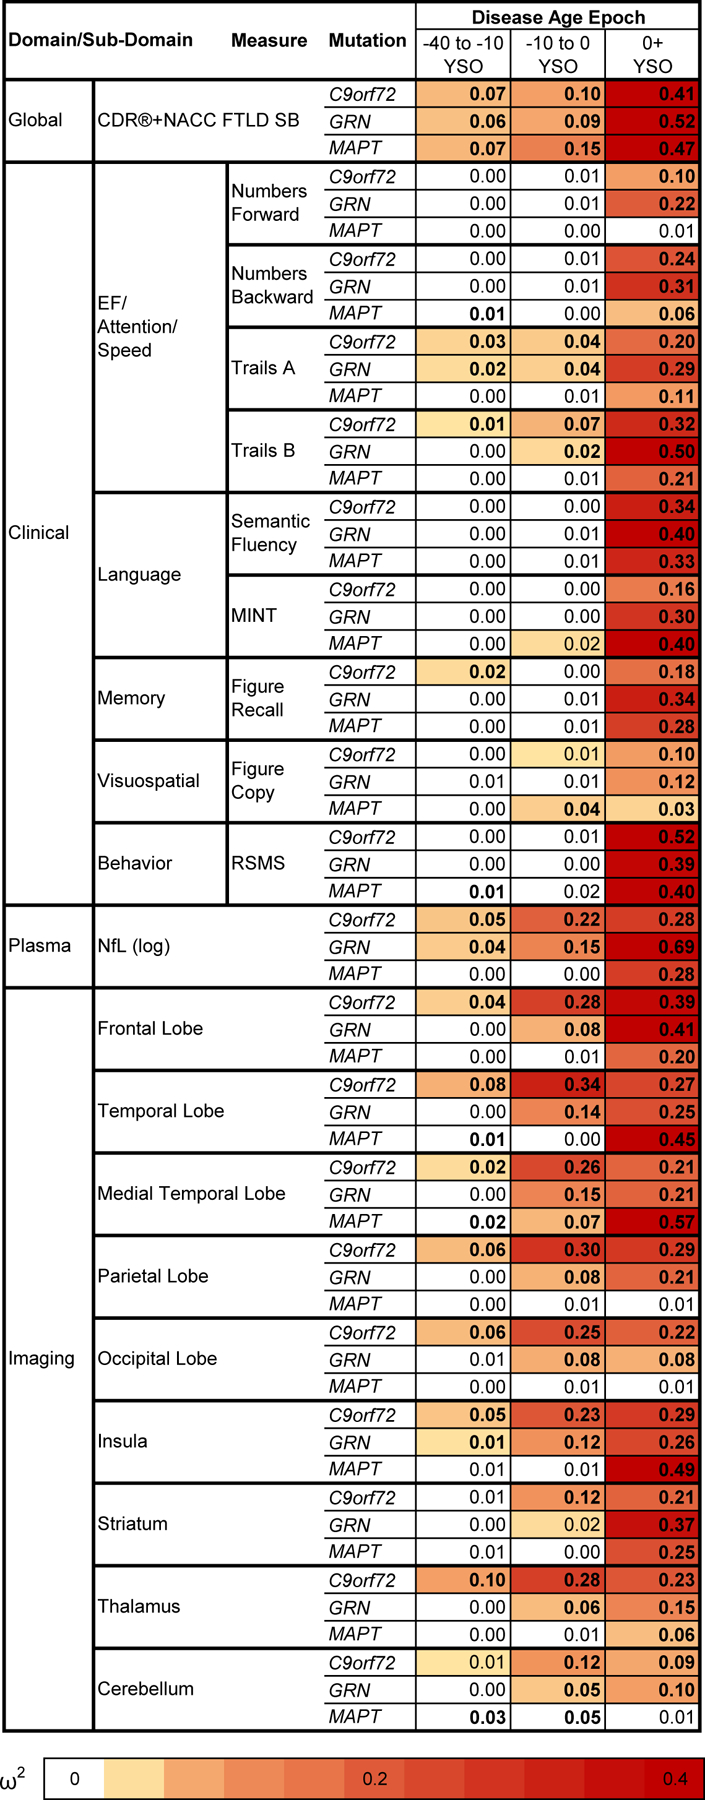
Cross-sectional baseline differences between mutation carriers and controls are presented as effect sizes (omega squared). Bolded cells indicate statistical significance (p < .05) using two-sided tests without multiple comparison correction. Comparisons in which mutation carriers are more impaired than controls are colored, with darker shades illustrating larger effect sizes. Note that statistical comparisons for the CDR®+NACC FTLD SB should be interpreted with caution given that controls were defined as having a baseline CDR®+NACC-FTLD=0 and thus have no variance due to this selection process.
Abbreviations: EF: Executive Functioning; NfL: Plasma neurofilament light chain levels; RSMS: Revised Self Monitoring Scale. CDR®+NACC FTLD SB: Clinical Dementia Rating Scale plus National Alzheimer’s Coordinating Center’s Frontotemporal Lobar Degeneration Module Sum of Boxes