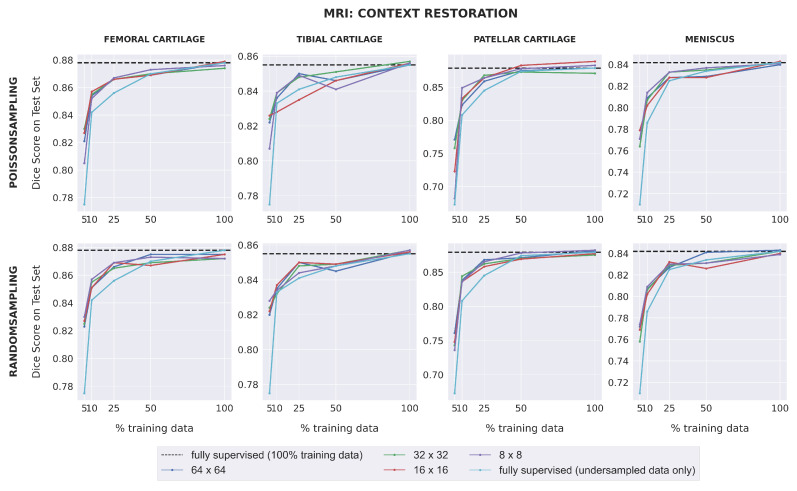
Figure 3.
The downstream segmentation performance on the MRI dataset for the Context Restoration pretext task as measured by the Dice score for every combination of patch size and sampling method used during pretraining, evaluated in five different scenarios of training data availability. In each scenario, every model is trained for segmentation using one of the five different subsets of training data as described in Section 2.1.1. The black dotted line in each plot indicates the performance of a fully-supervised model trained using all available training images. The light blue curve indicates the performance of a fully-supervised model when trained using each of the five different subsets of training data. Similar plots for the Context Prediction pretext task are given in Appendix C.

