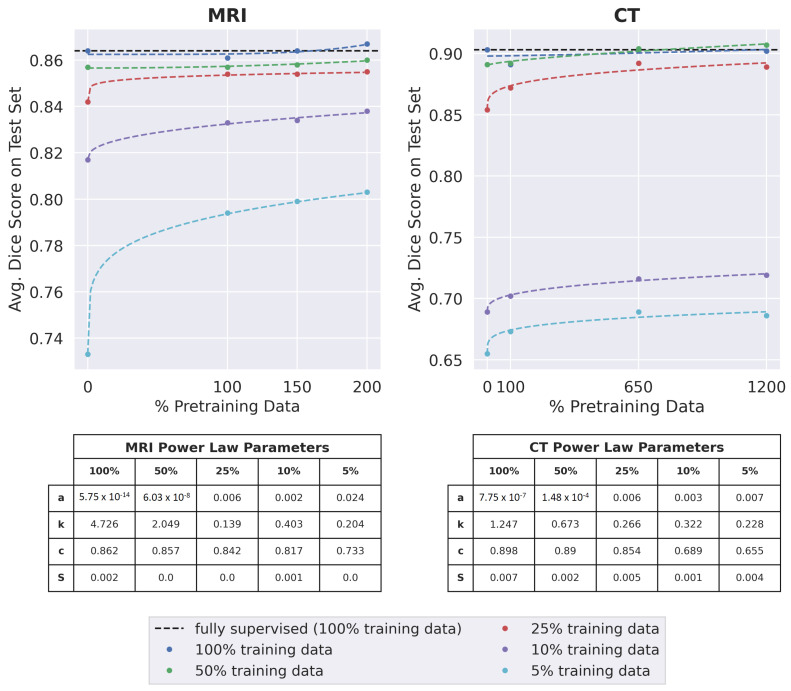
Figure 5.
The downstream segmentation performance of the optimally trained model when pretrained with different amounts of pretraining data and fine-tuned using each of the five training data subsets. 100% pretraining data refers to the regular training set for each dataset. The data point for 0% pretraining data is the performance of a fully-supervised model. The black dotted line indicates the performance of a fully-supervised model trained on all available training data for the appropriate dataset. The other dotted lines are the best-fit curves for each of the training data subsets, modeled as a power-law relationship of the form . The values of a, k, c, and the Residual Standard Error (S) for the best-fit curves are displayed in the two tables.

