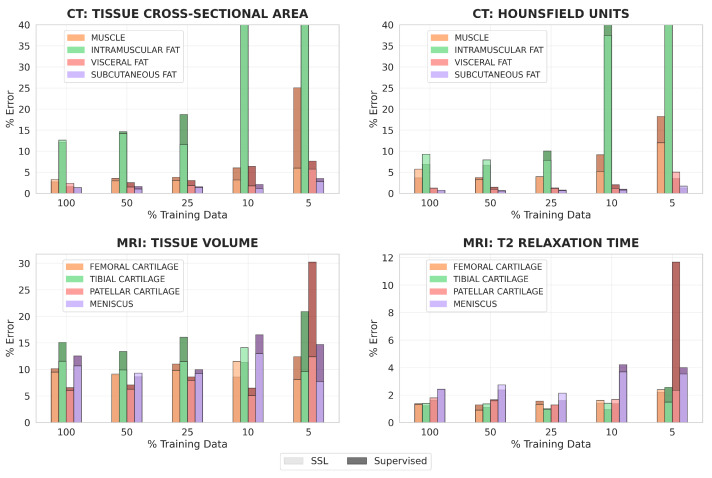
Figure 6.
A comparison of the percent error in calculating clinical metrics for the MRI and CT datasets between when the tissue segmentations are generated by fully-supervised models and when the tissue segmentations are generated by optimally trained models, pretrained using 200% data for MRI and 1200% data for CT. Each bar represents the median percent error across the test set for a particular tissue, clinical metric, and label regime. The percent error in the calculation of tissue cross-sectional area and mean HU for intramuscular fat extends beyond the limits of the y-axis when 10% and 5% labeled training data for segmentation is used.

