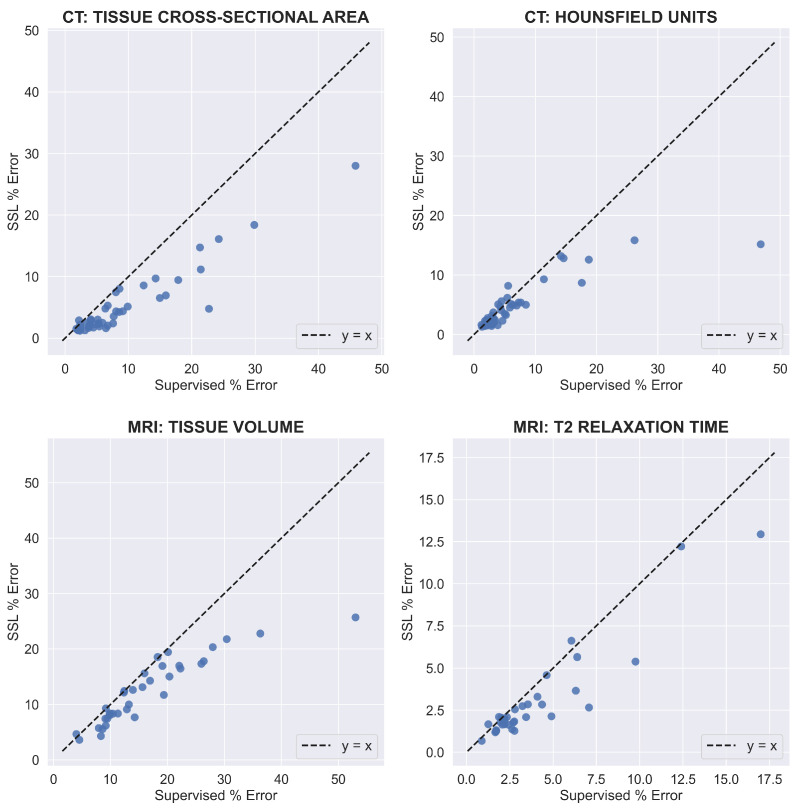
Figure 7.
The relationship between the percent error when using supervised learning and the percent error when using SSL. Each blue point represents an image in the test set for the appropriate dataset. The percent error was averaged over all classes and label-limited scenarios. For CT, the intramuscular fat was excluded to prevent large percent error values. For MRI T2 relaxation time, one point with a high percent error for supervised learning was excluded to reduce the range of the x-axis.

