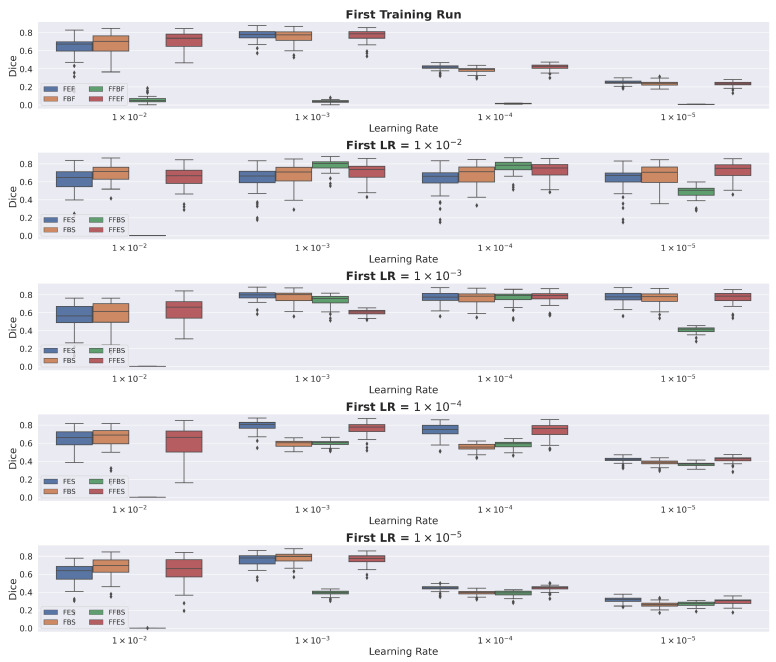
Figure A1.
Box plots displaying the spread of Dice scores among the volumes in the MRI test set. The top row displays the spread of Dice scores after each type of model was trained once, with the initial learning rate set to the appropriate value on the x-axis. The remaining four rows display the spread of Dice scores after each model in the first row was trained again, with the initial learning rate set to the appropriate value on the x-axis. We used the following structure for acronyms to distinguish between the different types of models: ABC. If A is F, the pretrained weights were fine-tuned immediately, and if A is FF, the pretrained weights were first frozen and then fine-tuned. If B is E, only the pretrained encoder weights were transferred, and if B is B, both the pretrained encoder and decoder weights were transferred. If C is F, the model was trained only once (the first training run), and if C is S, the model was trained a second time (the second training run).

