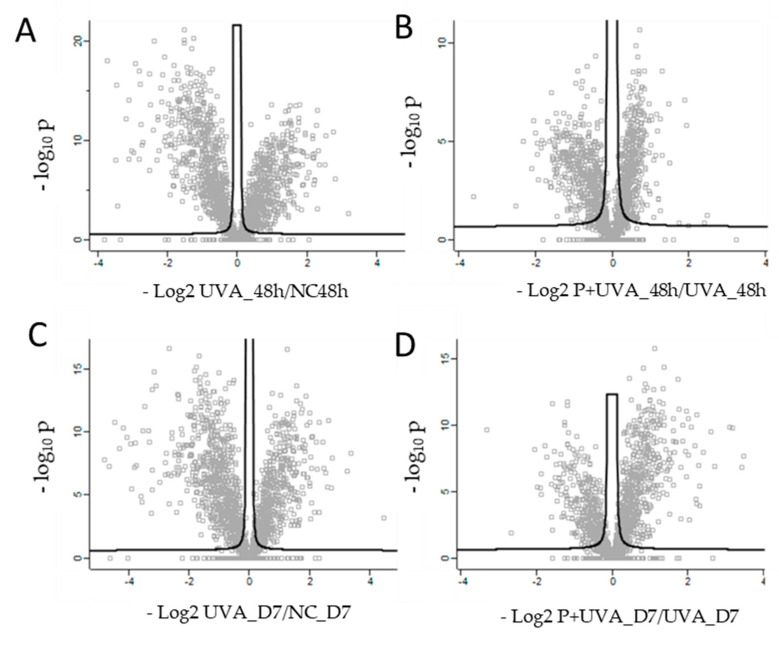
Figure 2.
Scatter plots of log2 ratio on x-axis against -log10 p-value on y-axis of significantly quantified proteins resulted from two sided t-test. (A) Quantified proteins in human dermis spheroids after 48 h of UVA exposure (UVA_48hvsNC_48 h). (B) Quantified proteins in carnosine pre-treated dermis versus control at 48 h (P+UVA_48hvsUVA_48 h). (C) Quantified proteins in human dermis spheroids after D7 of UVA exposure versus control (UVA_D7vsNC_D7). (D) Quantified proteins in carnosine pre-treated dermis versus control at D7 (P+UVA_D7 vs. UVA_D7). Statistical parameters (p < 0.05; q < 0.05, q = FDR adjusted p-value) were set to identify the differentially expressed proteins between samples. Biological and technical triplicates were analyzed.

