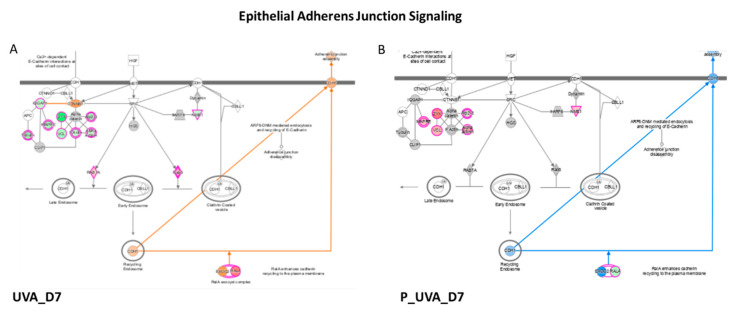
Figure 3.
Epithelial Adherens Junction Signaling enhanced in UVA vs. control in (A) and decreased in (B) P_UVA vs. UVA (IPA). Red shows the increased features covered by our input database and green shows those decreased features. The orange color of the central hub indicates an upregulation of the module. For the node shapes: Knowledge: IPA Legend (salesforce-sites.com) (Qiagen, USA).

