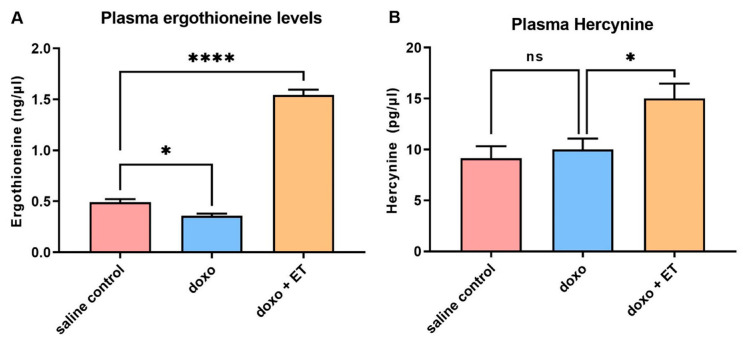
Figure 5.
Plasma ergothioneine and hercynine. A significant decrease was seen in plasma (A) ET levels with administration of doxorubicin relative to saline controls, similar to what was observed in the heart. A non-significant increasing trend for plasma hercynine was observed following doxorubicin administration (B). As expected, supplementation increased plasma levels of ET and hercynine. A 1-way ANOVA with Tukey’s multiple comparison test was performed; (A) * p < 0.05, **** p < 0.0001 vs. saline controls; (B) * p < 0.05 vs. doxorubicin alone.

