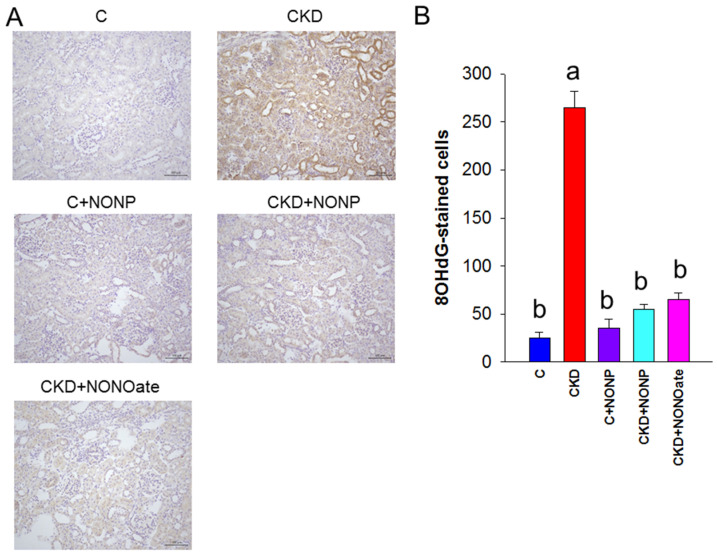
Figure 6.
(A) Representative micrographs of kidney sections demonstrated significant 8-OHdG-positive cells in glomeruli and tubular cells in CKD group as compared with the other groups. (B) Quantitative analysis of 8-OHdG-positive cells per microscopic field (200×). The letters a and b indicate the differences between the groups (p < 0.05, one-way ANOVA); n = 8/group.

