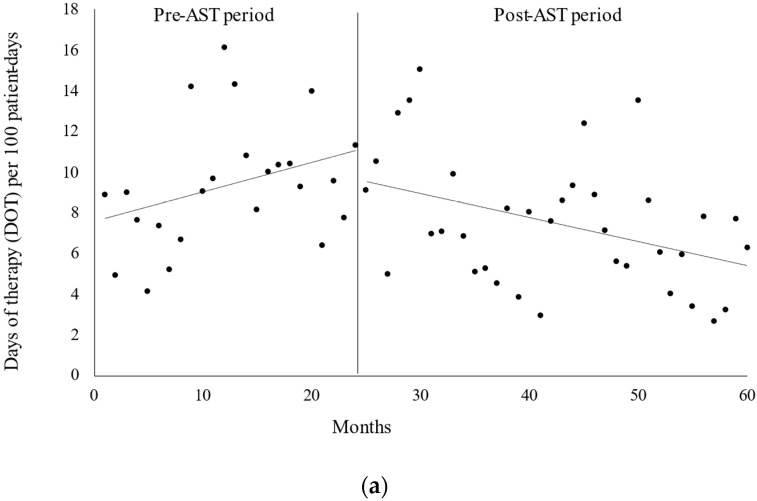
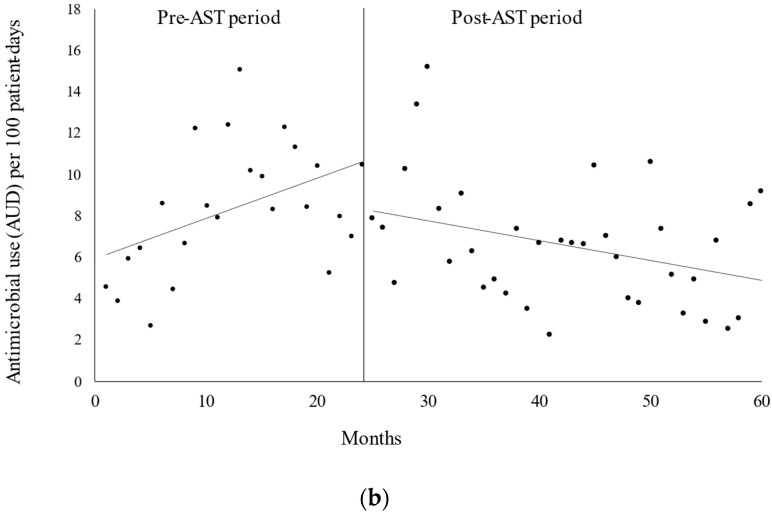
Figure 2.
(a) Interrupted time series analysis of the trends in days of therapy (DOT) for carbapenem per 100 patient-days evaluated before and after the implementation of the antimicrobial stewardship team (AST). Solid lines indicate the observed trend in the pre- and postimplementation periods. After AST implementation, the trend in the monthly DOT decreased (β = −0.263, p = 0.011). (b) Interrupted time series analysis of the trends in carbapenem antimicrobial use density (AUD) per 100 patient-days evaluated before and after the implementation of the antimicrobial stewardship program. Solid lines indicate the observed trend in the pre- and postimplementation periods. After AST implementation, the trend in the monthly AUD decreased (β = −0.291, p = 0.003).


