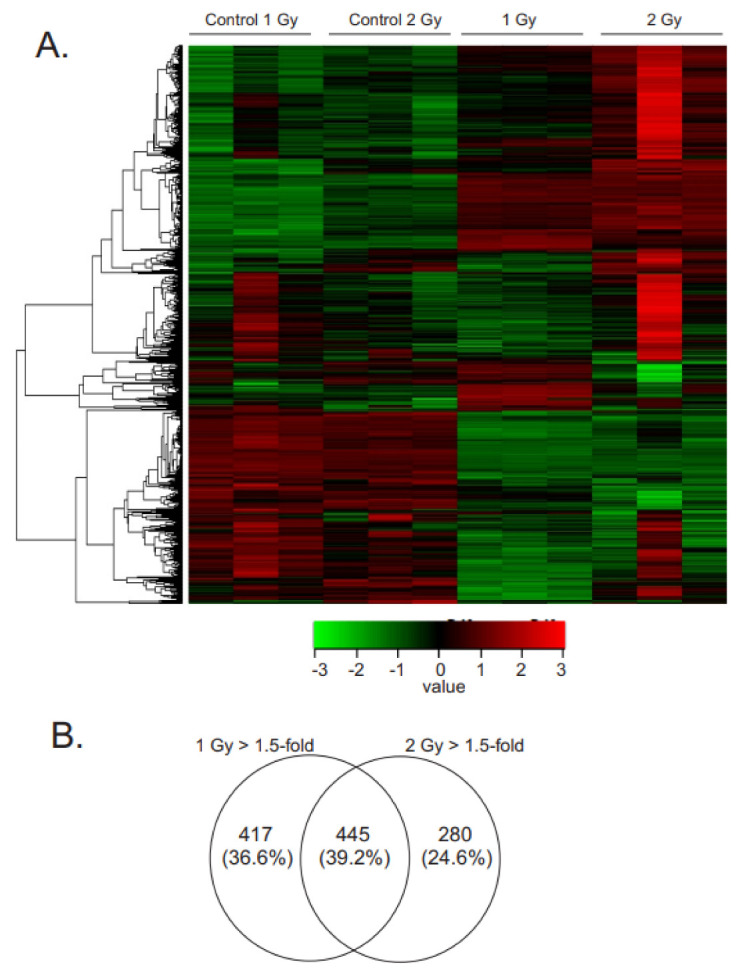
Figure 2.

Gene expression changes in irradiated MSCs. MSCs were grown to 60% confluence and exposed to 60Co irradiation at 0.66 cGy/h for 1 Gy (1 week) or 2 Gy (2 weeks). Control cells were cultured under identical conditions for each time point. RNAseq was performed using N = 3 samples for each condition. (A). Heat map indicates gene expression patterns following radiation exposure. (B). Venn diagram illustrating the number of genes with altered expression at each time point, q < 0.05, absolute fold change >1.5.
