
Figure 7.
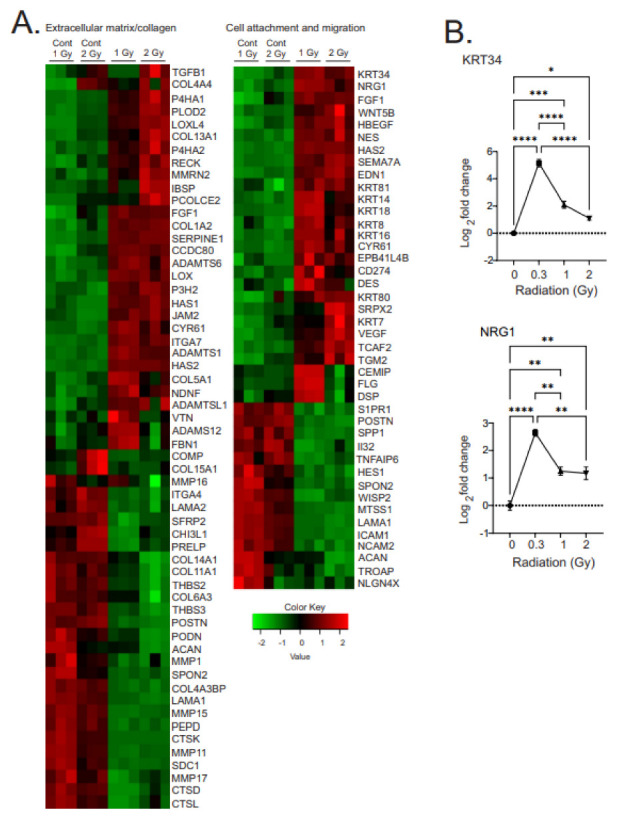
Heatmaps of gene expression changes for pathways involved in the regulation of extracellular matrix and collagen synthesis and cell attachment and migration. (A). RNAseq was used to identify gene expression changes in primary human MSCs following 1 or 2 Gy (0.66 cGy/h) 60Co irradiation. Control cells were cultured under identical conditions for 1 or 2 weeks. GO analysis was performed using DAVID and heatmaps were generated using genes with q < 0.05. Rows are centered and unit variance is applied to rows. (B). qPCR gene regulation using log base 2 scale fold change of genes supporting heatmaps of pathways. Data show averages ± SEM from N = 3 biological replicates with two technical repeats. * indicates p < 0.05, ** indicates p < 0.01, *** indicates p < 0.001, **** indicates p < 0.0001, respectively, compared with sham-irradiated control cells.