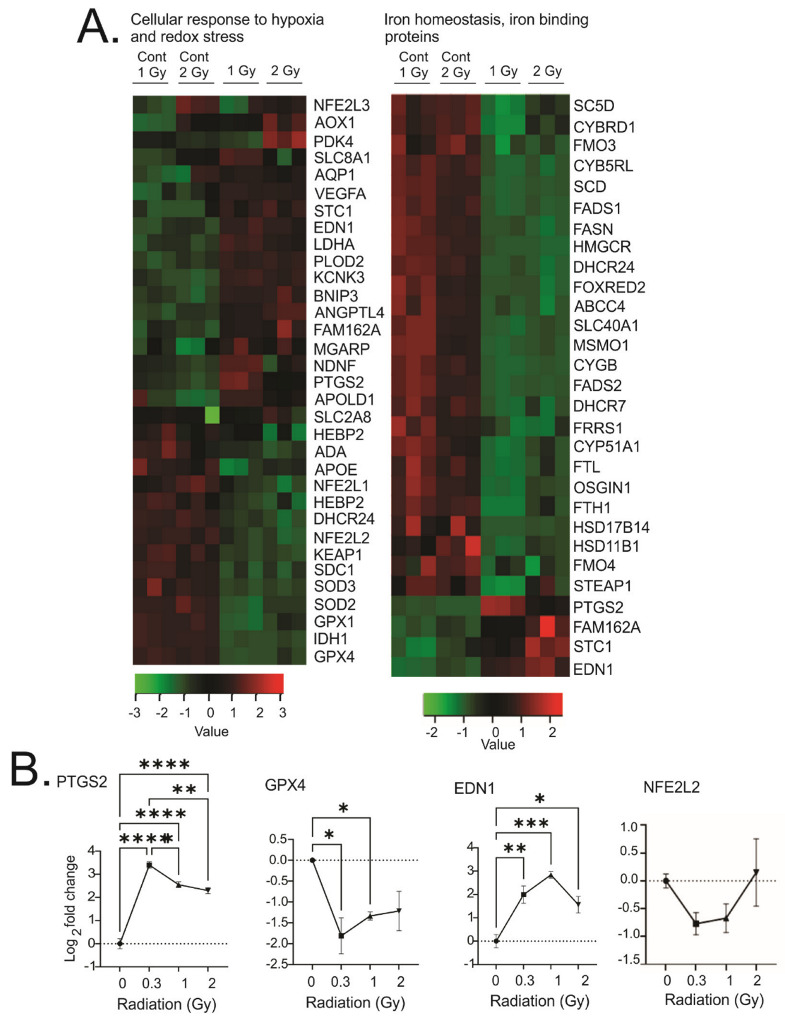
Figure 9.

Heatmaps of gene expression changes for pathways involved in cellular response to hypoxia or redox stress and iron homeostasis and iron-binding proteins. (A). RNAseq was used to identify gene expression changes in primary human MSCs following 1 or 2 Gy (0.66 cGy/h) 60Co irradiation. Control cells were cultured under identical conditions for 1 or 2 weeks. GO analysis was performed using DAVID and heatmaps were generated using genes with q < 0.05. Rows are centered and unit variance is applied to rows. (B). qPCR gene regulation using log base 2 scale fold change of genes supporting heatmaps of pathways. Data show averages ± SEM from N = 3 biological replicates with two technical repeats. * indicates p < 0.05, ** indicates p < 0.01, *** indicates p < 0.001, **** indicates p < 0.0001, respectively, compared with sham-irradiated control cells.
