
Figure 10.
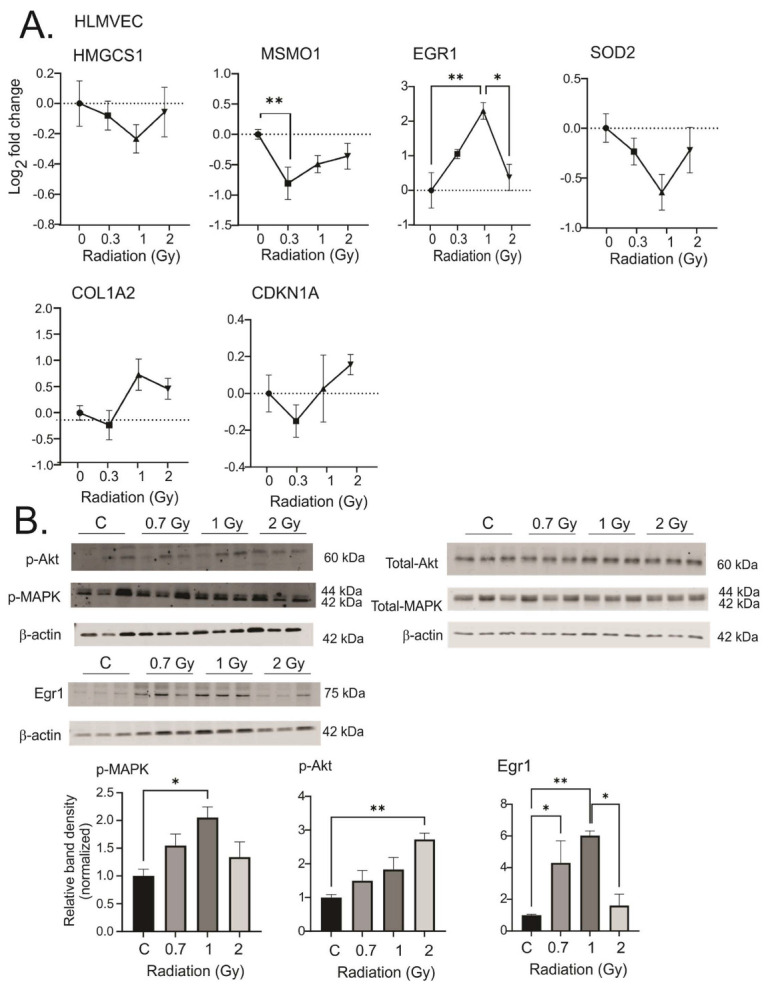
Response of human lung microvascular endothelial cells (HLMVECs) to chronic low dose-rate irradiation. HLMVECs were grown to 50% confluence and exposed to 60Co irradiation at 0.64 cGy/h for 1 Gy (1 week) or 2 Gy (2 weeks). Control cells were cultured under identical conditions. Irradiated and control cells were lysed at the same time, and either frozen for protein analysis or placed in RNAlater. (A). qPCR gene regulations are represented on a log base 2 fold change scale, using N = 3 biological replicates with two technical repeats. Graphs show means ± SEM; * indicates p < 0.05 and ** indicates p < 0.01, respectively, compared with sham-irradiated control cells. (B). Western blots of phosphorylated and total MAPK and Akt, and Egr1. Western blots were performed on N = 3 biological repeats. Bar graphs show average band densities normalized to β-actin. Graphs show means ± SEM; * indicates p < 0.05 and ** indicates p < 0.01, respectively, compared with sham-irradiated control cells.