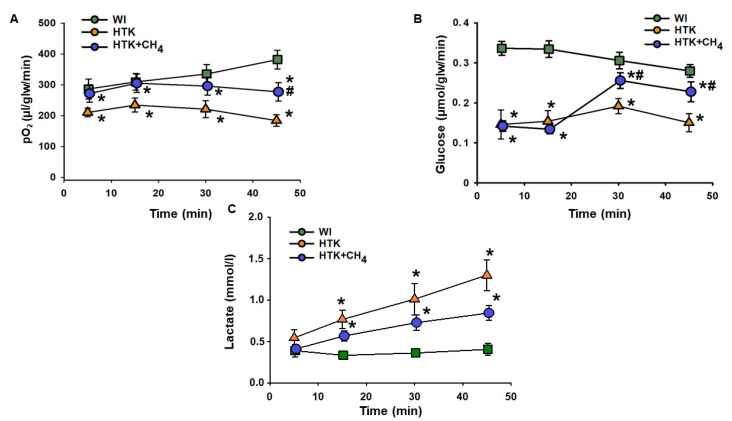
Figure 2.
Liver metabolic parameters. (A) Oxygen consumption determined as the difference in partial oxygen pressure of influent and effluent Krebs solution. (B) Glucose consumption determined as the difference in glucose concentration of influent and effluent Krebs solution. (C) Lactate content measured from effluent Krebs solution. The WI group is marked with a green square, the HTK group is marked with a yellow triangle and the HTK + CH4 group is marked with a blue circle. Data are presented as means ± SD. * p < 0.05 vs. WI; # p < 0.05 vs. HTK (one-way ANOVA and Tukey’s test).

