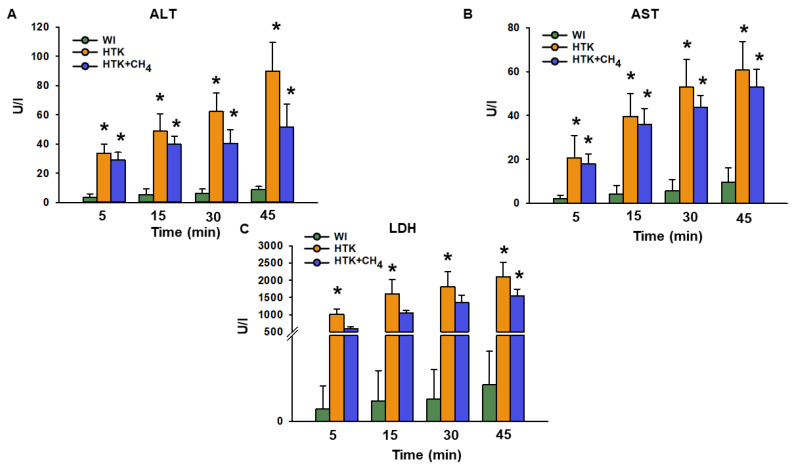
Figure 4.
Liver necroenzymes. (A) Alanine aminotransferase (ALT), (B) aspartate aminotransferase (AST) and (C) lactate dehydrogenase (LDH) measured from effluent Krebs solution. Data at 45 min represent the cumulative necroenzyme content. The WI group is marked green, the HTK group is marked yellow and the HTK + CH4 group is marked blue. Data are presented as means ± SD. * p < 0.05 vs. WI; (one-way ANOVA and Tukey’s test).

