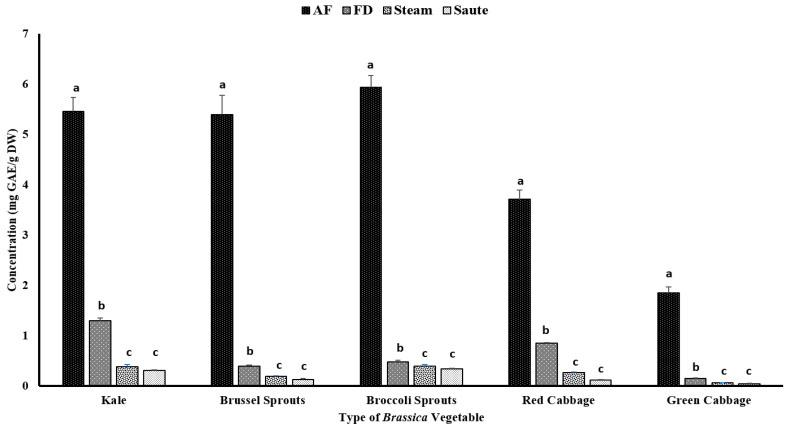
Figure 2.
The effects of thermal processing techniques on the total phenolic content (TPC) of the selected Brassica vegetables. The bars represent means ± standard deviations (n = 3). The different letters for each vegetable indicate statistical differences based on a two-way analysis of variance. GAE, gallic acid equivalents; DW, dry weight; mg, milligram; g, gram; AF, air-fry; FD, freeze-dry.

