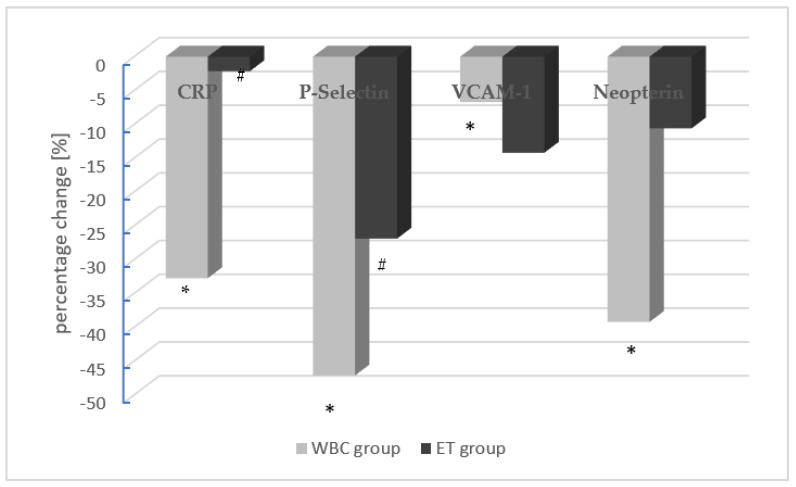
Figure 2.
The mean percentage changes in endothelium function parameters in the WBC group (gray) and the ET group (black). The concentration of a given parameter at the first collection was assumed as 100%. Statistically significant differences between the first and second measurement (pre- and post-procedure) are marked as * and # in the WBC and ET groups, respectively (hsCRP: high-sensitivity C-reactive protein; sVCAM-1: soluble vascular cell adhesion molecule-1; (p): plasma; (s): serum).

