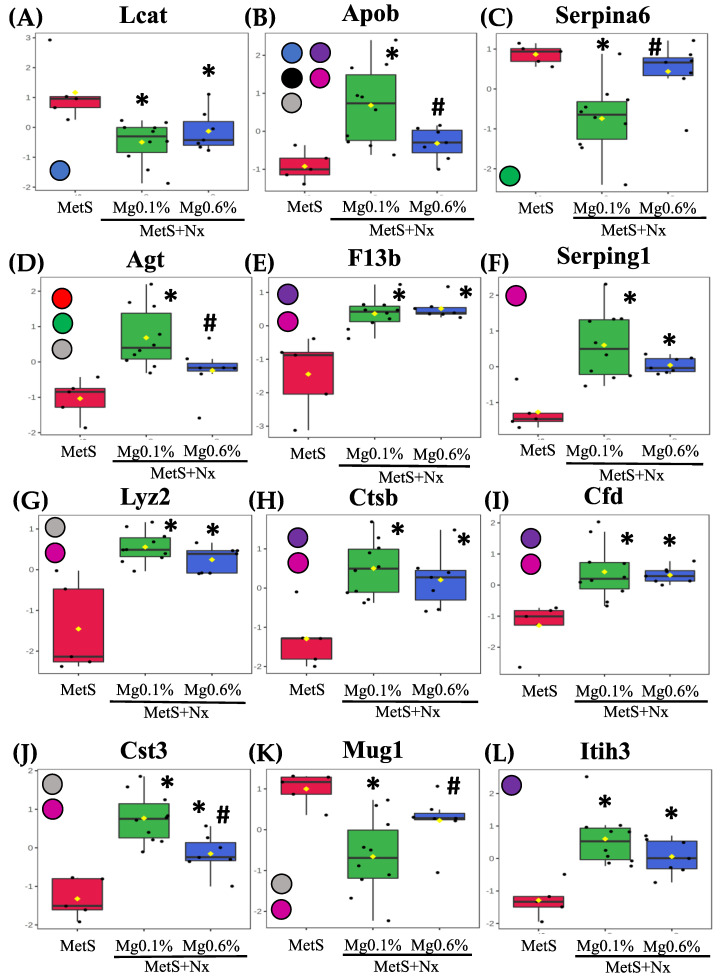
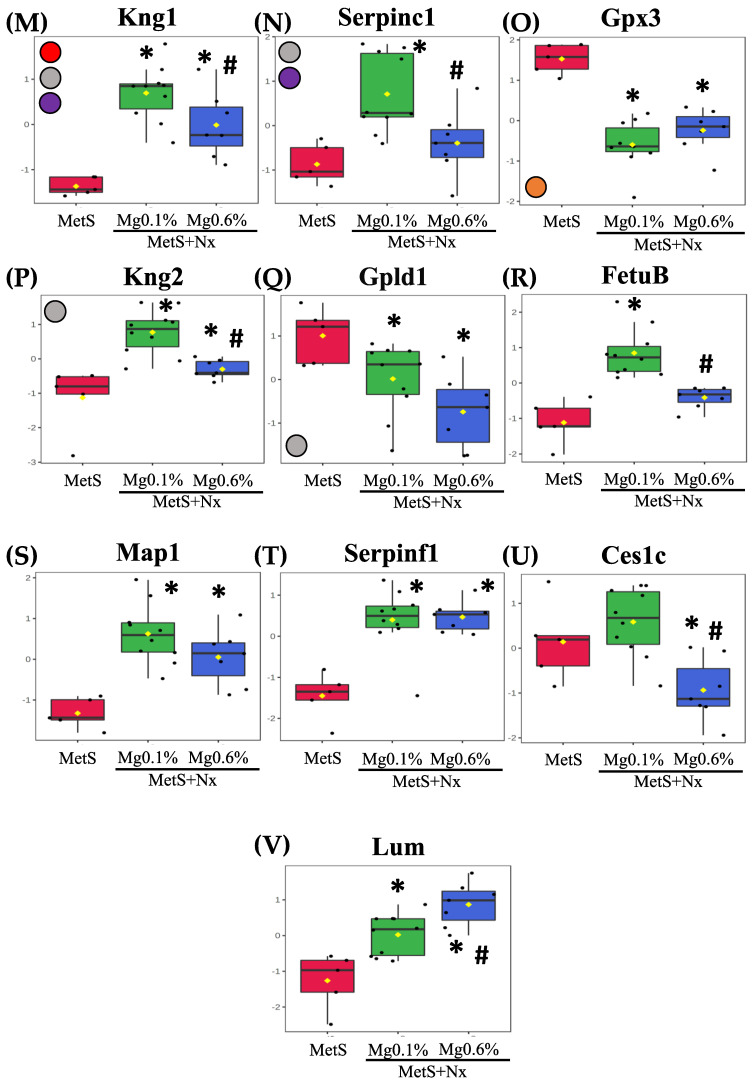
Figure 6.
Plasma proteins differentially expressed in the proteomic study. After plasma proteomic study by DIA-SWATH the following proteins were statistically significant after comparison between the experimental groups: (box plots are labeled with gene names that encode the respective proteins). (A) Phosphatidylcholine-sterol acyltransferase (Lcat), (B) Apolipoprotein B-100 (ApoB), (C) Corticosteroid-binding globulin (Serpina6), (D) Angiotensinogen (Agt), (E) Coagulation factor XIII B chain (F13b), (F) Plasma protease C1 inhibitor (Serping1), (G) Lysozyme (Lyz2), (H) Cathepsin B (Ctsb), (I) Complement factor D (Cfd), (J) Cystatin-C (Cst3), (K) Murinoglobulin-1 (Mug1), (L) Inter-alpha-trypsin inhibitor heavy chain H3 (Itih3), (M) Kininogen-1 (Kng1), (N) Antithrombin-III (Serpinc1), (O) Glutathione Peroxidase 3 (Gpx3) (P) Kininogen-2 (Kng2), (Q) Phosphatidylinositol-glycan-specific phospholipase (Gpld1), (R) Fetuin B (Fetub), (S) T-kininogen 1 (Map1), (T) Alpha2-antiplasmin (Serpinf1), (U) Carboxylesterase 1C (Ces1c) and (V) Lumican (Lum). Intensities were normalized to the mean value of each protein. The participation of these proteins in the different biochemical pathways according to reactome analyses is indicated through color circles in the left margin from each graphic. Red circle: Peptide ligand-binding receptors; Orange circle: Detoxification of ROS; Green circle: Regulation of lipid metabolism by PPARalpha; Blue circle: Plasma lipoprotein assembly, remodeling, and clearance; Black circle: Binding and uptake of ligands by scavenger receptors; Grease circle: Metabolism of proteins; Violet circle: Hemostasis and Pink circle: Immune system. * p < 0.05 vs. MetS group and # p < 0.05 vs. MetS+Nx+Mg0.1% group.


