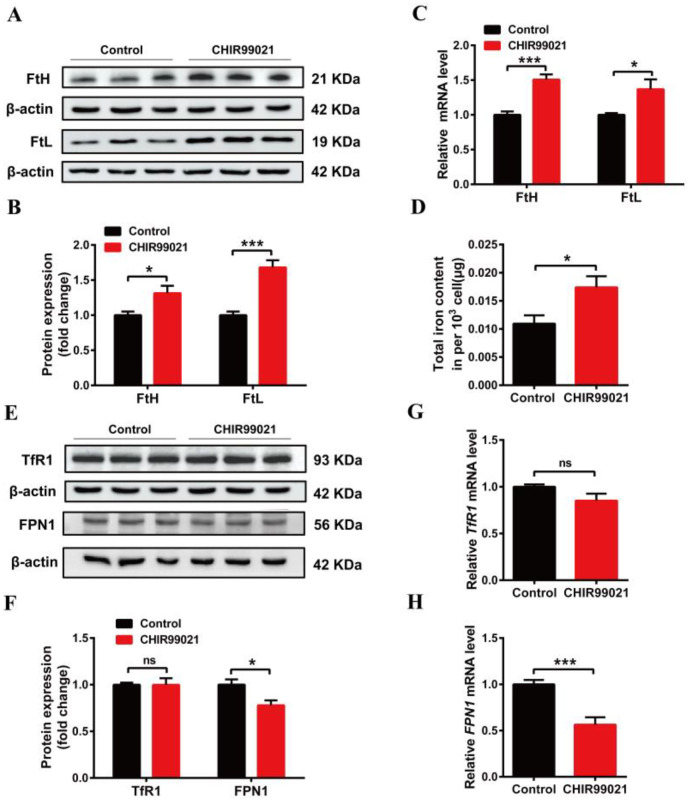
Figure 2.
Changes in iron metabolism in Neuro-2a cells treated with CHIR99021. (A,E) Western blot analysis of FtH and FtL (A), TfR1 and FPN1 (E) protein after the cells were treated with or without 3μM CHIR99021 [29,30] for 72 h. (B,F) Quantification of Western blot data of FtH and FtL (B), TfR1 and FPN1 (F). (C,G,H) qRT-PCR analysis of FtH and FtL (C), TfR1 (G), and FPN1 (H) mRNA levels. (D) ICP-MS detection of total cellular iron levels in Neuro-2a cells treated with or without CHIR99021. The relative expression levels are normalized to β-actin and then expressed as the fold of control group. The data are presented as the mean ± SEM. * p < 0.05, *** p < 0.001, ns, not significant.

