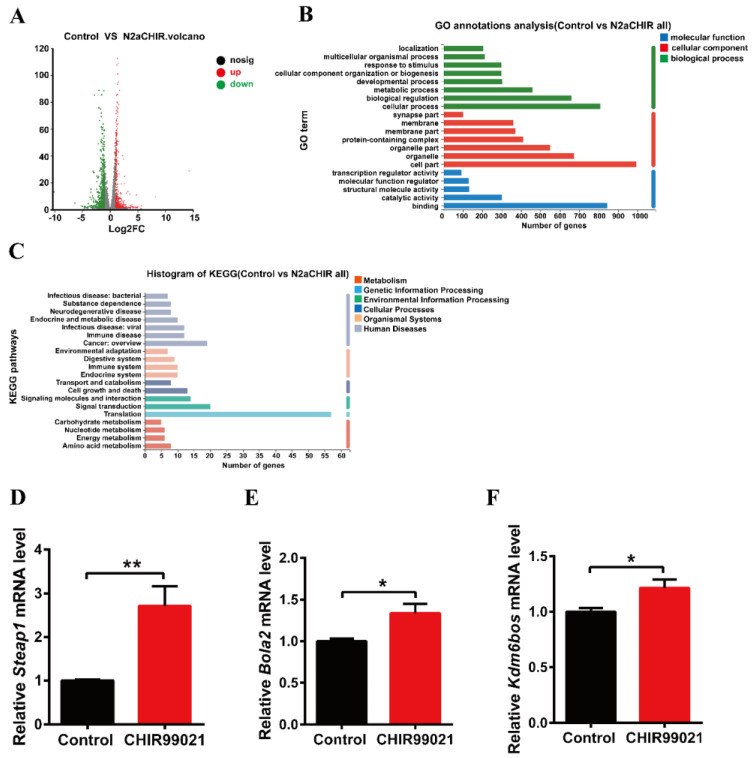
Figure 4.
Comparison of RNA-seq results and verification of the differentially expressed genes between control and CHIR99021-treated cells. (A) Volcano plot of mRNA expression differences. (B) GO enrichment analysis between control and CHIR99021-treated Neuro-2a cells. (C) Statistical classification analysis of KEGG pathways between control and CHIR99021-treated Neuro-2a cells. (D–F) qRT-PCR analysis of Steap1 (D), Bola2 (E) and Kdm6bos (F) mRNA levels with or without CHIR99021 treatment. The mRNA levels are normalized to β-actin mRNA levels and then expressed as the fold of control group. The data are expressed as the mean ± SEM. * p < 0.05, ** p < 0.01.

