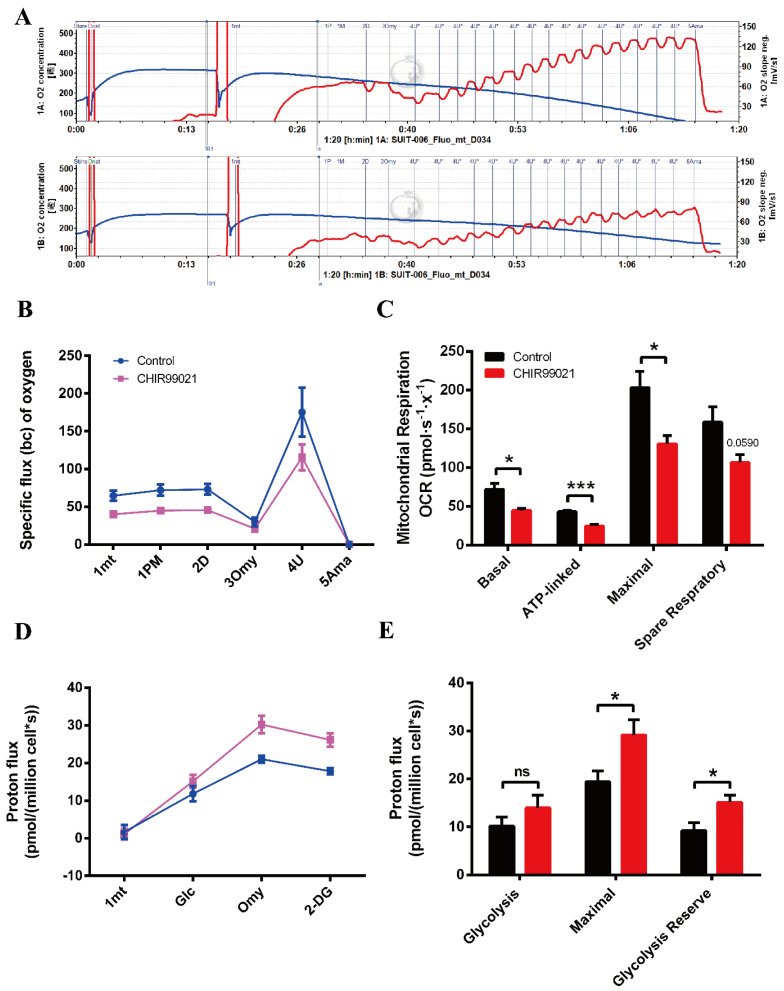
Figure 7.
CHIR99021 treatment decreases mitochondrial oxidative phosphorylation and enhances glycolytic capacity in Neuro-2a cells. (A) Overall oxygen consumption capacity of cells, as measured by O2k. Top panel, control group; bottom panel, CHIR99021-treated group. (B) Oxygen flux of cells after adding the indicated reagents. (C) Basal respiration, ATP-linked respiration, maximal respiration and spare respiratory capacity, as indicated by oxygen consumption rate (OCR) in Neuro-2a cells treated as shown. (D) Proton flux of cells after adding the indicated reagents. (E) Basal glycolysis, maximal glycolytic capacity and glycolysis reserve capacity in cells treated as shown. The data are expressed as the mean ± SEM. * p < 0.05, *** p < 0.001, ns, not significant.

