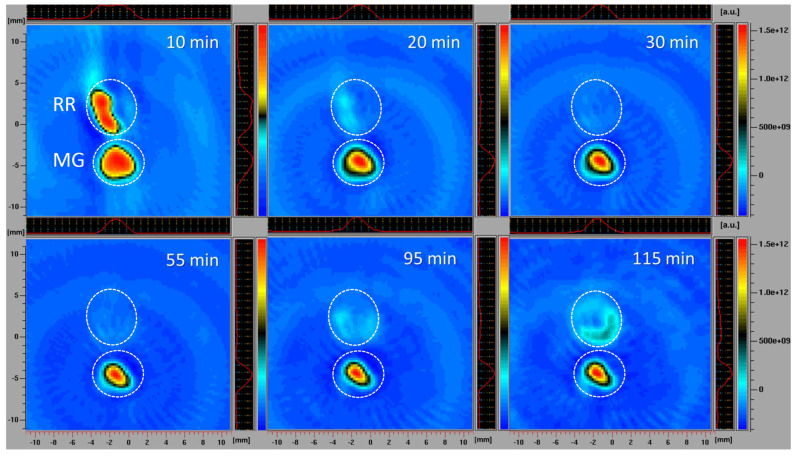
Figure 6.
X−band 2D EPR images of slices of MG and RR bittersweet fruits recorded 10, 20, 30, 55, 95, and 115 min after the administration of the spin probe. The upper signal relates to the ripe red (RR) and the lower to the mature green (MG) bittersweet fruits. The signal amplitude in arbitrary units is shown in the form of color scales, which represent the intensities/concentrations of the 3CP spin probe in samples, with the red color indicating the zones/tissues with the highest content of 3CP in the form of nitroxyl radical. The black/green colors indicate tissues with lower levels of 3CP in the form of nitroxyl radical. MG fruits were treated with 2 mM 3CP, and RR fruits with 15 mM 3CP.

