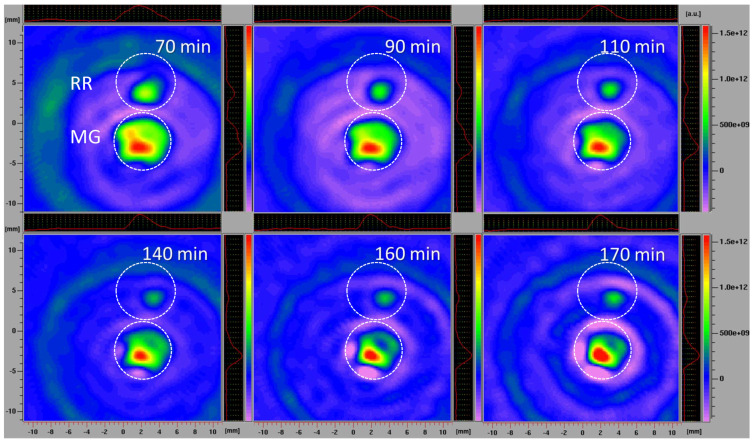
Figure 7.
L−band 2D EPR images of MG and RR bittersweet fruits recorded after 70, 90, 110, 140, 160, and 170 min. The upper signal relates to the RR and the lower to the MG fruits. The signal amplitude in arbitrary units is shown on color scales, which present the intensities/concentrations of the 3CP spin probe in samples, with red color indicating the zones/tissues with the highest content of 3CP in the form of nitroxyl radical. The light/dark green colors indicate tissues with lower levels of 3CP in the form of nitroxyl radical.

