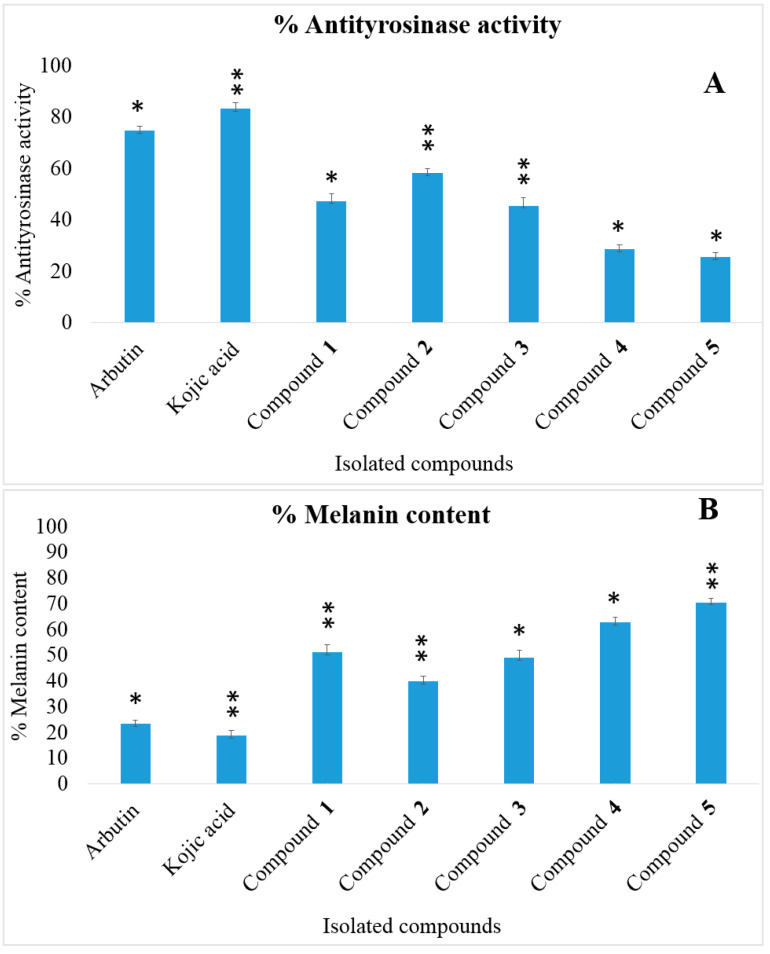
Figure 4.
Intracellular antityrosinase activity (A) and melanin content (B) in B16-F1 cells. Data were expressed as mean ± SD from three independent experiments. * p < 0.05 and ** p < 0.01 indicated a significant difference from the positive control group. Compound 1 = ω-hydroxymoracin C; Compound 2 = moracin M; Compound 3 = moracin C; Compound 4 = 3, 4, 3′, 5′-tetrahydroxybibenzyl; Compound 5 = piceatannol; positive controls = arbutin and kojic acid.

