
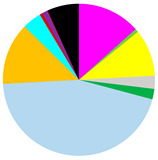
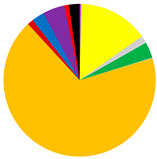
Table 3.
Number of taxa, maximum burial depth of macrofauna, mean values: abundance, BPC and IPC (min.–max), contribution of individual taxa to the formation of these parameters, and in each group of sites provided in Figure 3.
| Group 1 | Group 2 | Group 3 | |
|---|---|---|---|
| No. of taxa | 11 (6–16) | 8 (7–10) | 0 (0–1) |
| Max. burial depth [cm] | 14 (10–15) | 11 (6–15) | 0 (0–1) |
| Abundance [ind.∙m−2] | 11,030 (3628–30,557) | 3188 (2578–3851) | 63 (0–127) |
|

|

|
|
| BPC | 3412 (1576–5000) | 1683 (1412–1890) | 5 (0–13) |

|
|
|
|
| IPC | 1451 (581–1985) | 714 (632–785) | 1 (0–4) |

|

|
|
|

|
|||