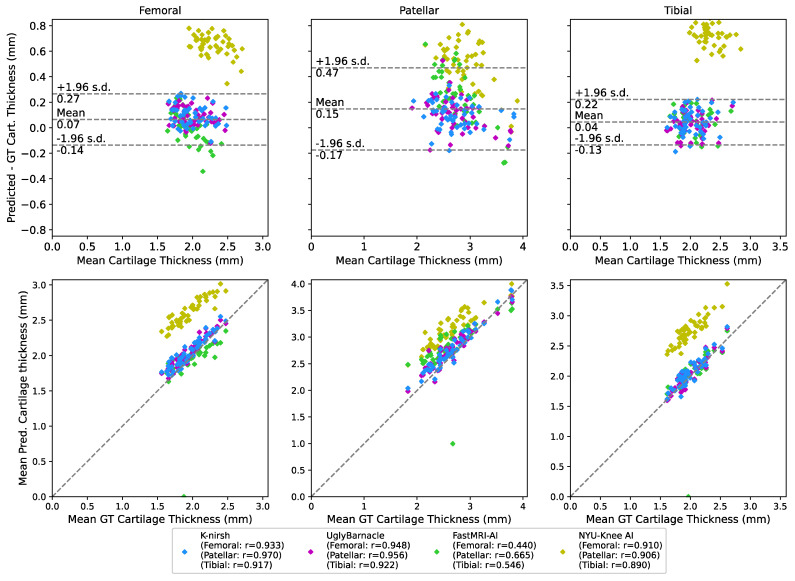
Figure 10.
Bland-Altman and correlation plots between predicted and ground truth cartilage thicknesses for each of the top 4 submissions, across each of the 3 cartilage compartments. The mean and standard deviations for these plots were calculated using the data points from K-nirsh, UglyBarnacle, and FastMRI-AI, given the thickness overestimations seen from NYU-Knee AI. The top three submissions saw minimal bias and strong fidelity to ground truth, while NYU-Knee AI appeared to slightly overestimate particularly tibial and femoral cartilage thicknesses. That said, correlation plots showed strong correlations between predicted and ground truth thicknesses for K-nirsh, UglyBarnacle, and NYU-Knee AI. FastMRI-AI visually appeared to have strong correlation as well, but an outlier case appears to have severely degraded the correlation coefficient. All told, these results collectively are quite promising that submissions are suitable for some downstream biomarker analysis.

