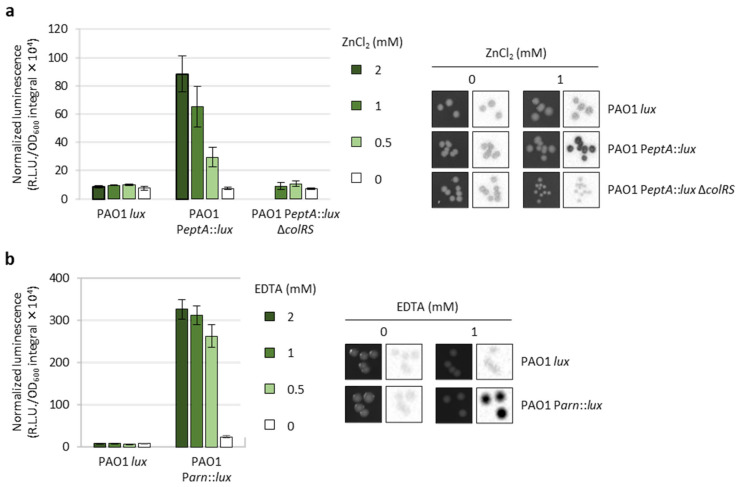
Figure 2.
Validation of the PAO1 PeptA::lux and PAO1 Parn::lux reporter strains. (a) Area under the normalized luminescence curve for PAO1 lux, PAO1 PeptA::lux, and PAO1 PeptA::lux ΔcolRS cultured in lysogeny broth (LB) supplemented with different ZnCl2 concentrations, and colony growth (left images) and luminescence (right images) of the same strains on LB agar plates in the presence or absence of 1 mM ZnCl2. PAO1 PeptA::lux ΔcolRS did not grow at 2 mM ZnCl2 (data not shown and [20]). (b) Area under the normalized luminescence curve for PAO1 lux and PAO1 Parn::lux cultured in LB supplemented with different EDTA concentrations, and colony growth (left images) and luminescence (right images) of the same strains on LB agar plates in the presence or absence of 1 mM EDTA. Values are the mean (±SD) of three independent assays. Images are representative of three independent experiments providing similar results.

