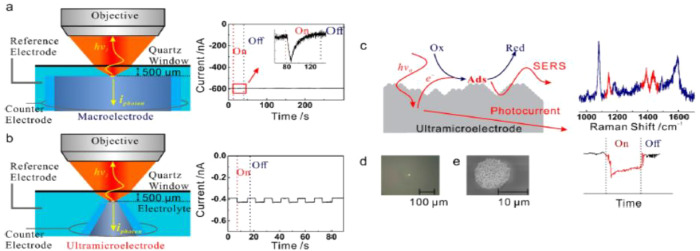
Figure 12.
Schematic comparison between conventional EC-SERS on a macroelectrode (a) and the microphotoEC (μPEC)-SERS on an ultramicroelectrode (UME) (b). (c) Schematic illustration of the correlation of the plasmon-mediated chemical reactions (PMCRs) with hot electron transfer in μPEC-SERS, (d) optical microscopy image of the UME in the μPEC-SERS measurement, and (e) SEM image of the SERS-active silver UME. Reproduced with permission from ref (163). Copyright 2020 American Chemical Society.

