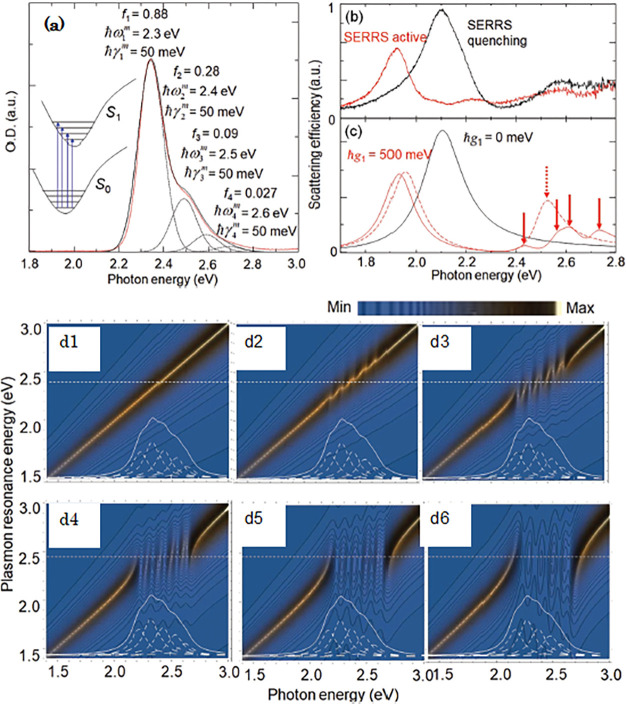
Figure 14.
(a) Absorption spectrum of an aqueous solution of R6G (red curves) fitted with four Lorentzian curves representing the exciton and its three phonon replicas (dashed curves); ωnm and γn are indicated in the panel. The black curve is the sum of the Lorentzian curves and values of fn are indicated in the panel. Inset: Photoinduced transitions from the electronic excited state S1 to the electronic ground state S0, including the vibrational energy levels corresponding to the four Lorentzian peaks. (b) Experimental plasmon resonance spectra before (red curve) and after (black curve) the loss of SERRS activity. (c) Spectra calculated by the coupled oscillator model (eq 18) with ℏg1 = 500 meV using a single exciton (dashed red curve), an exciton with three phonon replicas (red curve), and no exciton coupled with the plasmon (black curve). The hybridized resonances in the higher energy region are indicated by a dashed arrow (strong coupling between the plasmon and a single exciton) and solid arrows (strong coupling between the plasmon and a single exciton with its phonon replicas), respectively. (d) Anticrossing properties appearing in the plasmon resonance spectra calculated using eq 18 under the conditions with ℏΩvac 2 values of (d1) 0, (d2) 50, (d3) 100, (d4) 150, (d5) 200, and (d6) 250 meV. Reproduced with permission from ref (68) for panels a–c. Copyright 2018 American Institute of Physics. Reproduced with permission from ref (180) for panel d. Copyright 2020 American Institute of Physics.

