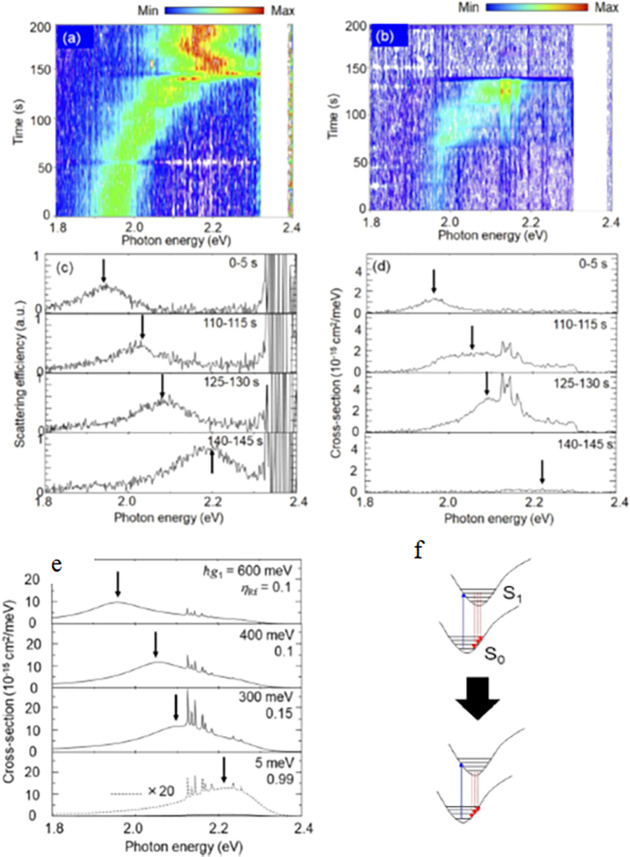
Figure 18.
(a, b) Images of the temporal changes in the plasmon resonance and resonant SERS in the SEF spectra for the NP dimer, respectively. The white bar indicates the loss by the laser notch filter. (c, d) Plasmon resonance spectra and resonant SERS with SEF spectra extracted from panels a and b, respectively, at detection times indicated in the panels. The maxima of the envelopes are indicated by arrows. (e) Combined spectra of the resonant SERS and SEF calculated from the product of eq 18 and the sum of σR (Raman cross-section) and σF (fluorescence cross-section). Values of ℏg1(coupling energy) and ηRf (quantum efficiency) for the SEF are indicated in the panels, while the value of ηRR (quantum efficiency) for the resonant SERS is fixed at 0.001; maxima of the envelopes are indicated by arrows. (f) Schematic image of the supposed changes from ultrafast to conventional SEF with decreasing ℏg1. Reproduced with permission from ref (68). Copyright 2018 American Institute of Physics.

