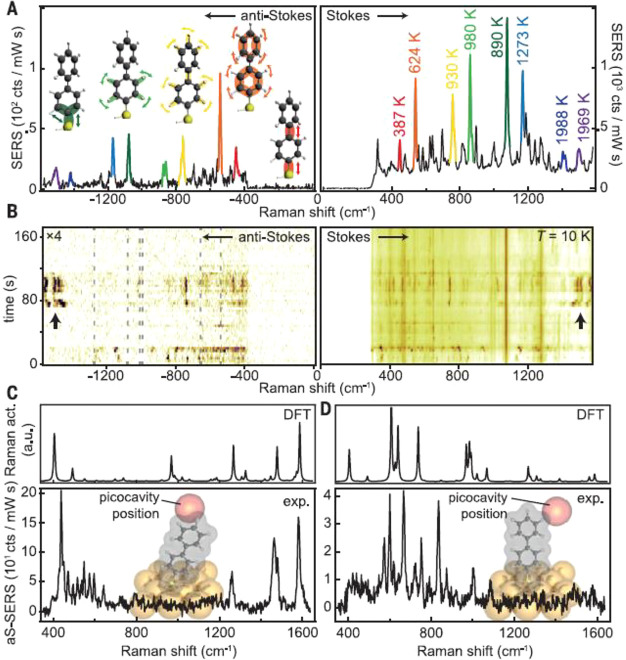
Figure 26.
Raman spectra reveal changes of the SERS selection rules. (A) Anti-Stokes/Stokes spectra at a time when additional picocavity-induced lines are present. Colors correspond to the same lines on the Stokes and anti-Stokes sides, with vibrational eigenmodes and effective temperatures shown. (B) Time-series anti-Stokes (aS) and Stokes (S) SERS. Dashed lines (aS) mark the expected aS line positions corresponding to the ever present (persistent) S lines from the many molecules in the larger nanocavity. (C, D) Comparison of two experimental spectra (bottom) with DFT simulated spectra (top) under the assumption of atomic-scale field confinement (inset shows geometries; red sphere denotes field localization for the simulations). Reprinted with permission from ref (56). Copyright 2016 American Association for the Advancement of Science.

