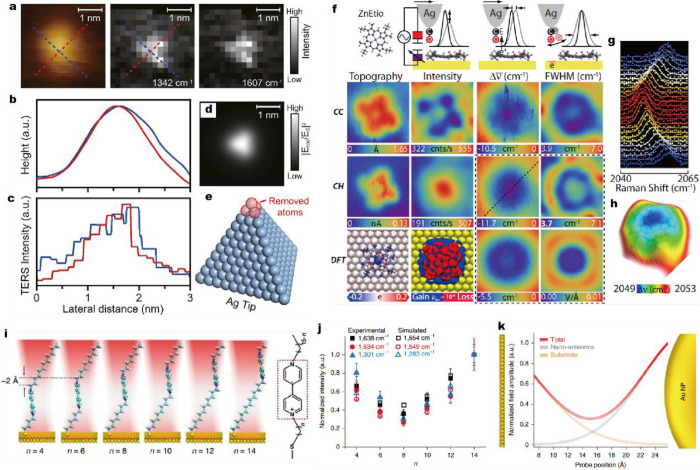
Figure 33.
Probing the field distributions of nanocavity plasmon and SMs by Ångström-resolved TERS. (a) STM image of a single 44BPY molecule on Ag(111) and the corresponding TERS mappings for the 1342 and 1607 cm–1 vibrational modes. (b) STM height line profile and (c) TERS intensity line profile of the 1342 cm–1 vibrational mode for a single 44BPY molecule along the line trace from the STM and TERS image in panel a, respectively. (d) Calculated local field distribution for the Ag tip shown in panel e. (e) Atomistic model of the closely packed Ag tip with the top two-layer atoms removed. Panels a–e are adapted with permission from ref (318). Copyright 2019 Wiley-VCH GmbH. (f) Simultaneously obtained STM and TERS images on the intensity, frequency shift, and line width for a single ZnEtio molecule under constant-current and -height modes. (g) Stark shift of the CO vibration corresponding to the dashed line from the constant-height frequency-shift map in panel f. (h) Electrostatic field surface obtained by color-coding the Stark shift on the STM constant-height topography. Panels f–h are adapted with permission from ref (319). Copyright 2018 American Association for the Advancement of Science. (i) Schematic of the molecular conformations for a series of radical cation viologens in the nanocavity of a SERS system. (j) Normalized experimental (solid symbols) and simulated (open symbols) Raman peak intensities for V2+ viologens in the nanocavity formed by a Au nanoparticle (NP) and Au(111) surface. (k) Normalized electric field distribution of the nanocavity formed by a Au NP and Au(111) surface. Panels i–k are adapted with permission from ref (320). Copyright 2020 Springer Nature.

