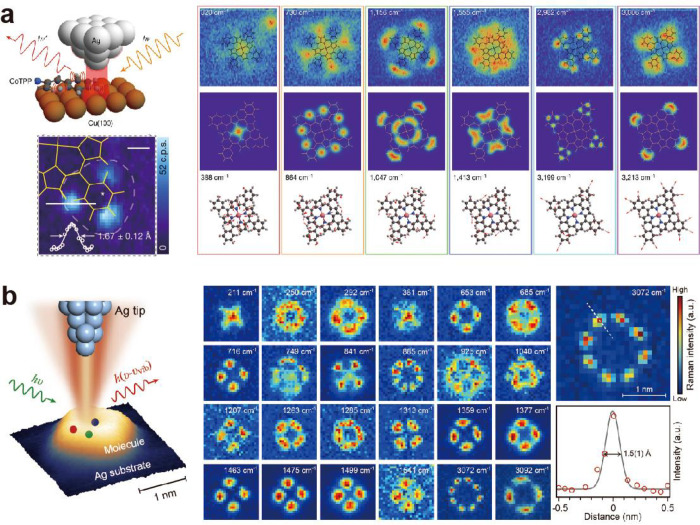
Figure 34.
Ångström-resolved Raman spectromicroscopy for a SM. (a) TERS mapping images for representative vibrational normal modes of CoTPP on Cu(100). Adapted with permission from ref (257). Copyright 2019 Springer Nature. (b) Spatial mapping images for various Raman peaks of a single MgP molecule on Ag(100). Adapted with permission from ref (256). Copyright 2019 Oxford University Press on behalf of China Science Publishing & Media Ltd.

