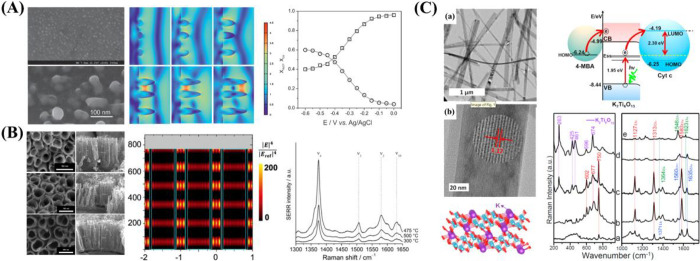
Figure 43.
(A) SEM images and electric field distribution of the synthesized half ellipsoidal TiO2 nanostructures and the molar ratios of oxidized (squares) and reduced (circles) Cyt b5 on the TiO2 electrodes. Adapted with permission from ref (412). Copyright 2013 Wiley-VCH Verlag. (B) SEM images and calculated electric field for the TiO2 nanotube electrodes and SERS spectra of Cyt b5 adsorbed on the fabricated TiO2 nanotube electrodes with different annealing temperatures. Adapted with permission from ref (413). Copyright 2018 Wiley-VCH Verlag. (C) SEM and HRTEM images of the K2Ti6O13 NWs; structure of the K2Ti6O13 NWs; schematic diagram of the photoinduced CT mechanism; Raman and SERS spectra of cytochrome c (Cyt c), the spectra from bottom to top are for the oxidized form of Cyt c (532 nm laser), reduced form of Cyt c (532 nm laser), Fe3+ Cyt c on K2Ti6O13 (532 nm laser), Fe3+ Cyt c on K2Ti6O13 (633 nm laser), and reduced form of Cyt c (633 nm laser). Adapted with permission from ref (414). Copyright 2021 Elsevier.

