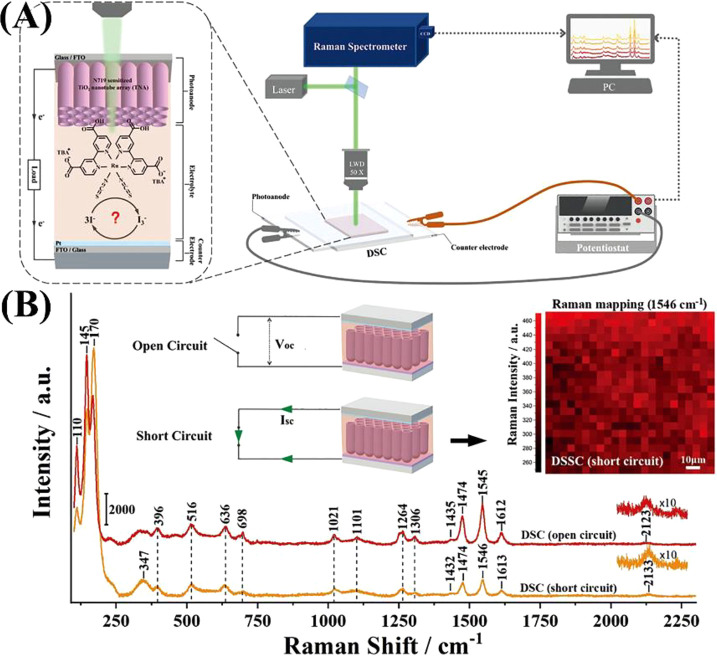
Figure 44.
(A) Schematic representation of the DSSC analysis by operandor resonance Raman spectroscopy combined with I–V testing. (B) SERS spectra of the DSSC under open circuit (OC) and short circuit (SC) conditions. Adapted with permission from ref (419). Copyright 2020 Wiley-VCH Verlag.

