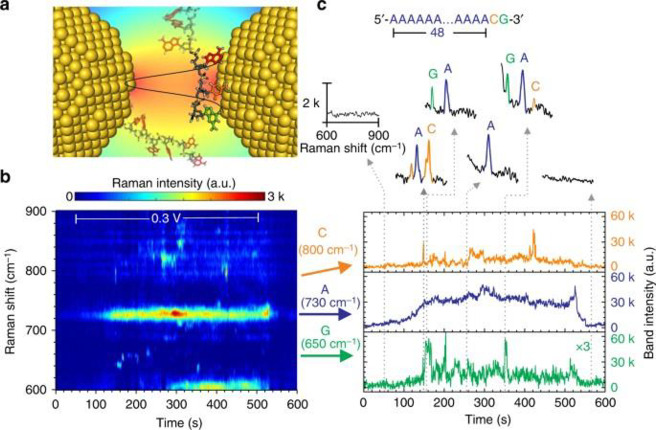
Figure 47.
(a) Schema of temporarily adsorbed ss-DNA inside the nanoslit. Objects are not at the same scale. (b) Temporal contour map of the nanoslit SERS of the 50-mers ss-DNA oligonucleotide 5′-poly(dA) 48 dCdG-3. The differently colored dash-line frames indicate the characteristic Raman bands of G (green), A (blue), and C (orange), respectively. (c) Temporal traces of the band intensity of the nucleobases marked in panel b. The insets show six representative spectra. Reproduced with permission from ref (454). Copyright 2018 The Authors.

