Figure 49.
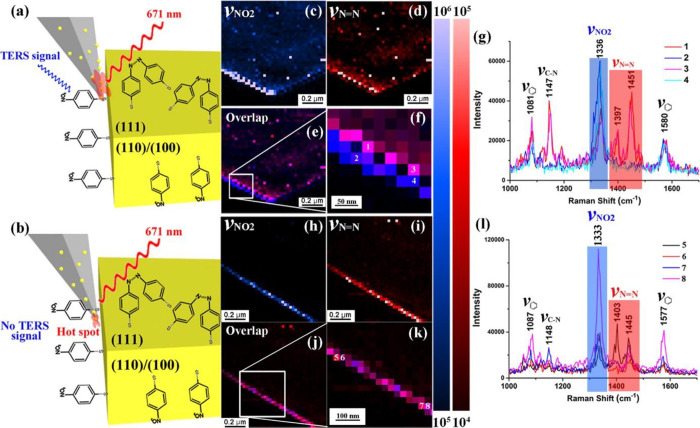
(a, b) Proposed schemes showing the HSs located at both the shaft and apex (a) and only at the apex (b) of the TERS probe. (c, d), (h, i) High-resolution TERS images of the distribution of the −NO2 (c, h) and N=N groups (d, i) obtained with TERS active (4) and inactive (5) probes, respectively. (e, j) Corresponding overlap images. (f, k) Zoomed-in TERS images of the white rectangle position in panels e and j, respectively. (g, l) Typical TERS spectra extracted from the marked position in panels f and k. Reproduced with permission from ref (490). Copyright 2018 American Chemical Society.

