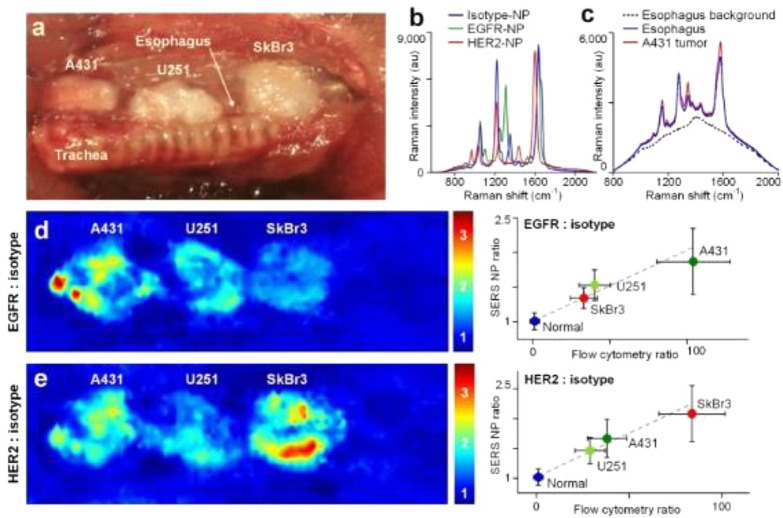
Figure 51.
In vivo endoscopic molecular imaging performed with multiplexed SERS NPs delivered via oral gavage. (a) Photograph of a surgically exposed rat esophagus implanted with three tumor xenografts. (b) Reference spectrum of the SERS NPs that were mixed together and topically applied into the rat esophagus in this study. (c) Background spectrum of esophagus tissue and raw (mixed) spectra acquired from NP-stained normal esophagus tissue and A431 tumor implants. (d, e) Images showing the concentration ratio of (d) EGFR-NPs vs isotype-NPs and (e) HER2-NPs vs isotype-NPs. Right-side plots show the correlation between the image-derived intensities from various tissue types (normal esophagus and three tumors) and the corresponding fluorescence ratio (targeted-NP vs isotype-NP) from flow-cytometry experiments with the cell lines used to generate the various tumor xenografts. All values in the figures are presented as mean ± standard deviation; R > 0.95. Reproduced for permission from ref (498). Copyright 2015 The Optical Society of America.

